Hierarchical Clustering
Bài đăng này đã không được cập nhật trong 4 năm
Clustering is a technique that usually uses in data-intensive application. E-comerce system wanna track customer browsing/purchasing to automatically detect group of same customers and giving suitable product. As we know, different customers have different tastes of buying and choosing products. Howevers, the differences always based on some basic factors such as age, income, gender or geographical places. To understand and dividing data into same group, we need to use clustering techniques. In this post, I will show and present a basic to group data into clusters
1. Main idea
After collecting data, our data maybe stay in same format , howevers it's quite difficult for us to get the connection bettween inviduals. Hierrachical clustering builds up a hierarchy of groups by continously merging the two most similar groups which starts as a single item. In each iteration, this method calculates the distances between every pair of groups and the closest ones are merged together to form a new group. This will be repeated until there is only one group. This picture will show how it works
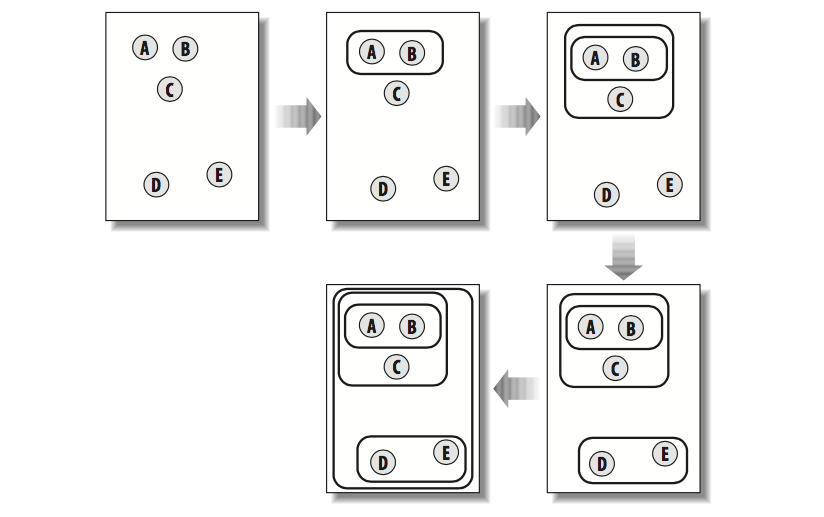
In this figure, each data sector is show as a separted point (A, B, C, D, E). At the glance, we can easily to detect that A and B are most closest items so from these point we will group A and B into single group. After that, the process will be repeated, the point C has smallest distance to group A-B so A-B-C now is a new group. These steps will repeat until A-B-C-D-E are grouped into single group
2. In Action
To clarify this idea, there're no better ways than applying to real example. We will collect latest data from over 80 different sources through RSS. And from this data, we'll grouping similary blogs and text into same group then display all of them to a dendrogram to display relationship between each group data. Before diving into it, we need to prepere sample data from RSS. In this post, I don't have enoug space to show more detail about this, but the main format for soure date will be liked this
Source    word1    word2    word3    word4 .....
source1     12      10        5        7   .....
From different data sources, we will get the most frequent words and count how many times they appear in each data source. To get RSS data, Python has useful library named feedparser which can easy download and install through pip or native installation.
2.1 Distance
In our last post about Building a simple recommendation system, I have shown two main methods to find out similarities between two sub data and in this post, I will employ Pearson correlation to calculate distance between two group data
def pearson(v1, v2):
    '''Simple sum'''
    sum1 = sum(v1)
    sum2 = sum(v2)

    '''Sum of the square'''
    sum1Sq = sum([pow(v, 2) for v in v1])
    sum2Sq = sum([pow(v, 2) for v in v2])

    '''Sum if the products'''
    pSum = sum([v1[i]*v2[i] for i in range(len(v1))])

    '''Calculate r (Pearson score)'''
    num = pSum - (sum1*sum2/len(v1))
    den = sqrt((sum1Sq - pow(sum1, 2)/len(v1)) * (sum2Sq - pow(sum2, 2)/len(v1)))

    if den == 0: return 0

    return 1.0 - num/den
Remember that the Pearson correlation returns 1.0 when two item match perfectly (Ideal case) and close to 0.0 when there's no relationship at all. Our code will use 1.0 minus to Pearson correlation to create a smaller distance between item that are more similar
2.2 Data sub-group
Initially, each sub data, specificly in our example, a row showing word counts is a sub-group which is an atom for hierarchical clustering algorithm. Basically, we need to identify each sub-group by something that can be delete or create new from previous item.
That's why we need bicluster class.
class bicluster:
    def __init__(self, vec, left=None, right=None, distance=0.0, id=None):
        self.left = left
        self.right = right
        self.vec = vec
        self.id = id
        self.distance = distance
2.3 Building Hierarchical cluster
Wraping the main idea from the first part, our code starts by createing a gorup of clusters that are just original items. From there, the main loop of the function search for two best matches by grouping one by one the find the the pair has smallest distance. The data for this new cluster is the average of the data for the two old clusters. this process will be repeated until only one cluster remains. I can say that all the steps consuming time and machine resource to get it done so it's better to store the correlation results for each pair, since they will be calculated a gain until one of the items in the pair is merged into another cluster. Here's main code
def hcluster(rows, distance=pearson):
    distances = {}
    currentclustid = -1

    '''Clusters are initially just the rows'''
    clust = [bicluster(rows[i], id = i) for i in range(len(rows))]

    while len(clust) > 1:
        lowestpair = (0, 1)
        closest = distance(clust[0].vec, clust[1].vec)

        '''Loop through every pair looking for the smallest distance'''
        for i in range(len(clust)):
            for j in range(i+1, len(clust)):
                '''distances is the cache of distance calculations'''
                if(clust[i].id, clust[j].id) not in distances:
                    distances[(clust[i].id, clust[j].id)] = distance(clust[i].vec, clust[j].vec)

                d = distances[(clust[i].id, clust[j].id)]

                if d < closest:
                    closest = d
                    lowestpair = (i,j)

        '''calculate the average of the two clusters'''
        mergevec = [(clust[lowestpair[0]].vec[i] + clust[lowestpair[1]].vec[i])/2.0 for i in range(len(clust[0].vec))]

        '''create the new cluster'''
        newcluster = bicluster(mergevec, left=clust[lowestpair[0]], right=clust[lowestpair[1]], distance=closest, id=currentclustid)

        '''cluster ids that weren't in the original set are negative'''
        currentclustid -= 1
        del clust[lowestpair[1]]
        del clust[lowestpair[0]]
        clust.append(newcluster)

    return clust[0]
Tobe noted that, we don't have a process that merges two sub-data into single one. Everything we can do is delete two old bicluster and create the new one with average word counts
2.4 Display results
As we can see from above, hcluster just return single cluster so how can we present it to someone that doesn't know anything about programing to understand? That's why we need to show it to as a Dendrogram
def getheight(clust):
    '''Return 1 if this is an endpoint'''
    if clust.left == None and clust.right == None: return 1

    '''Otherwise the height is the same of the height of each branch'''
    return getheight(clust.left) + getheight(clust.right)

def getdepth(clust):
    '''The distance of endpoint is 0.0'''
    if clust.left == None and clust.right == None: return 0

    '''The distance of a branche is the greater of two sides plus ots own distance'''
    return max(getdepth(clust.left), getdepth(clust.right)) + clust.distance

def drawdendrogram(clust, labels, jpeg='clusters.jpg'):
    '''height and width'''
    h = getheight(clust) * 20
    w = 1200
    depth = getdepth(clust)

    '''scaling'''
    scaling = float(w - 150)/depth

    '''Create a new image with white background'''
    img = Image.new('RGB', (w,h), (255,255,255))
    draw = ImageDraw.Draw(img)

    draw.line((0, h/2, 10, h/2), fill=(255,0,0))

    '''Draw the first node'''
    drawnode(draw, clust, 10, (h/2), scaling, labels)
    img.save(jpeg, 'JPEG')
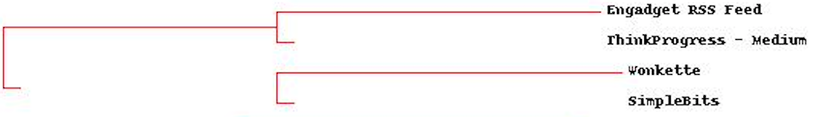
This picture will show how the data source close to another
 Enough now? I don't think so. We try our best to get data from over 80 different sites and now just showing its name. Sounds inaccepable
Our boss need to know more detail about all the contents that showing in blogs/news. So now we need to reverse the data source from site-based words count to word-based grouping
Enough now? I don't think so. We try our best to get data from over 80 different sites and now just showing its name. Sounds inaccepable
Our boss need to know more detail about all the contents that showing in blogs/news. So now we need to reverse the data source from site-based words count to word-based grouping
def rotatematrix(data):
    newdata = []
    for i in range(len(data[0])):
        newrow = [data[j][i] for j in range(len(data))]
        newdata.append(newrow)
    return newdata
After change and drawing result, I got a huge picture and it will make you give up on reading my post due to so long content. But I will show the most interesting piece of its
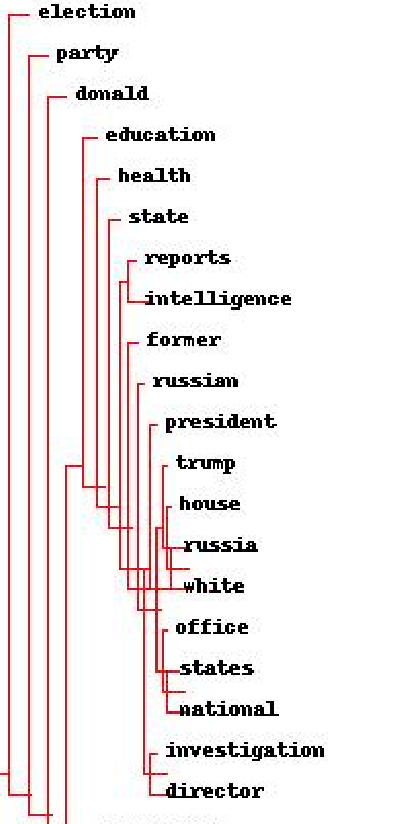 I guess President Trump has a prettry busy time when he received so much attentions. All of us know that his style is alway accompanied with scandals and I think all the key words above can help all of you to get a big picture about his scandal (lol)
3. Bottom Line
I guess this technique is just a fundamental thing for someone to start to work in data section.Applying it to your bussiness right now? I guess it will take much more time to collect enough data which can reveal something. However, let start to learn it from now to make sure that in next centure we're not the slaves of machines
All rights reserved
