STACKDRIVER - GETTING STARTED
Bài đăng này đã không được cập nhật trong 5 năm
1. Overview
Google Stackdriver performs monitoring, logging and diagnostics to help businesses ensure optimal performance and availability. The service gathers performance metrics and metadata from multiple cloud accounts and allows IT teams to view that data through custom dashboard, charts and reports.
Google Stackdriver is natively integrated with Google Cloud Platform and hosted on Google infrastructure, but the monitoring capabilities can also be used for applications and virtual machines (VMs) that run on Amazon Web Services Elastic Compute Cloud (AWS EC2). In addition, it can pull performance data from open source systems, such as Cassandra, Apache Web Server and ElasticSearch.
2. Create a Compute Engine instance
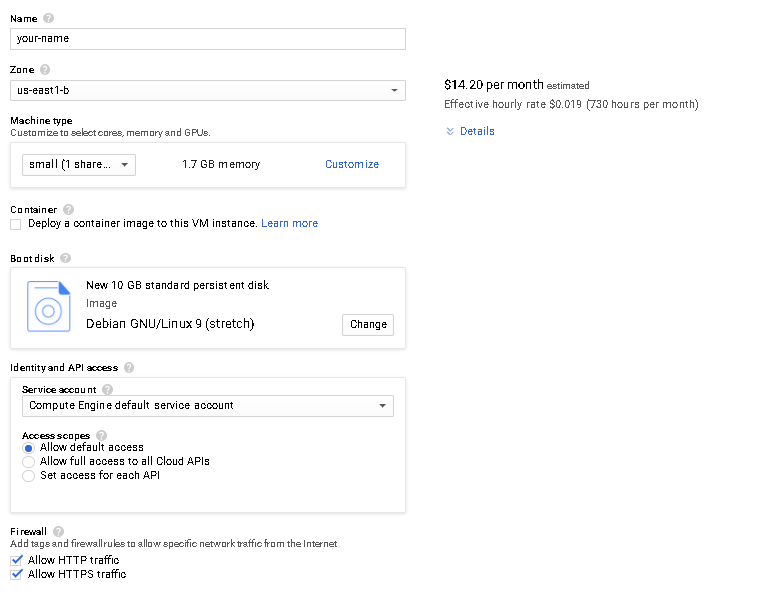
In the GCP Console dashboard, go to Menu > Compute Engine > VM instances, then click Create Instance.

Fill in the fields for your instance as follows:
Name: your-name (name must be lowercase, number, hyphen)
Machine type: Small
Firewall: Select both Allow HTTP traffic and Allow HTTPS traffic
Leave the rest of the fields with their default values.
Click Create.
3. Add Apache2 HTTP Server to your instance
If you were to browse to the instance's external IP address, you'd get an error. Now you'll learn how to fix that.
In the Console, click the SSH to open a terminal to your instance.
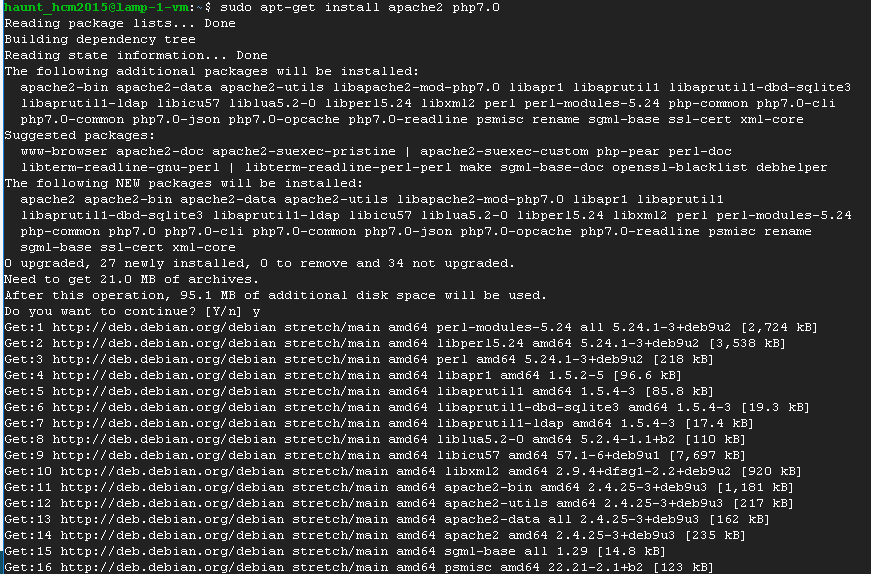
Run the following commands in the SSH window to set up Apache2 HTTP Server:

sudo apt-get update
sudo apt-get install apache2 php7.0
When asked if you want to continue, type Y
Note: If you cannot install php7.0, use php5.

Restart service apache2 :
![]()
If you visit http://<EXTERNAL_IP>, you see the Apache2 default page:

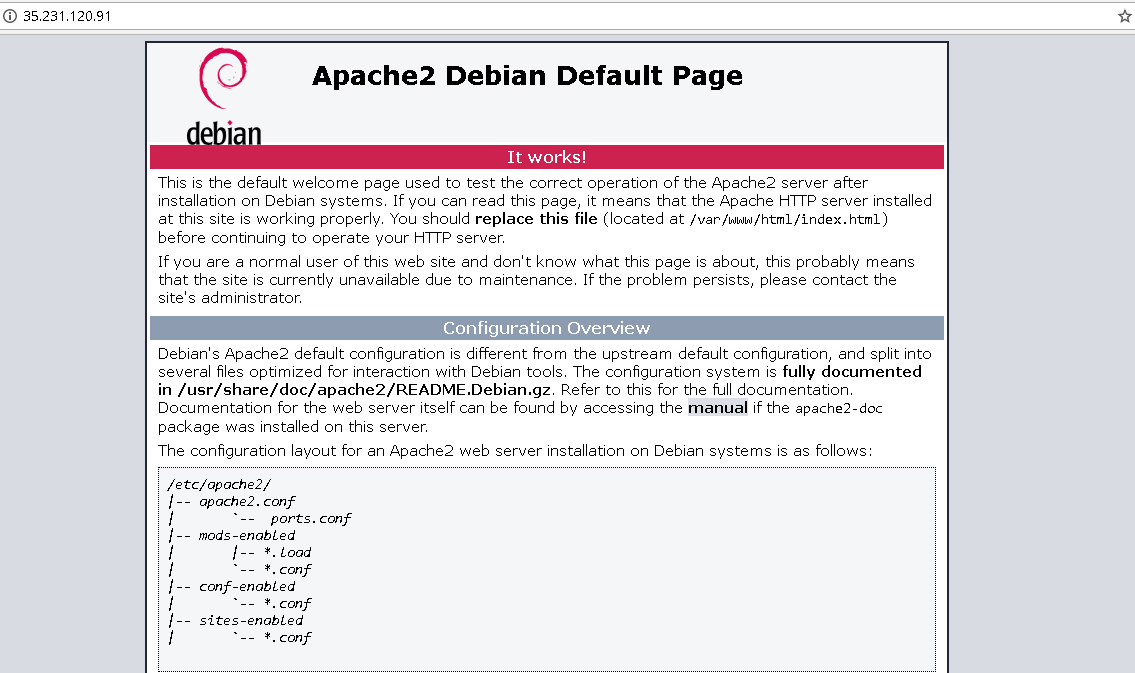
Make sure that you're using HTTP and not HTTPS for the external IP address
4. Create a Stackdriver account


On the following pages:
- Add Google Cloud Platform projects to monitor - click Continue
- Monitor AWS accounts - Skip AWS Setup
- Install the Stackdriver Agents - Run the commands shown on screen in the SSH window for your instance. Click Continue when you're done.
- Get Reports by Email - select No reports then Continue.

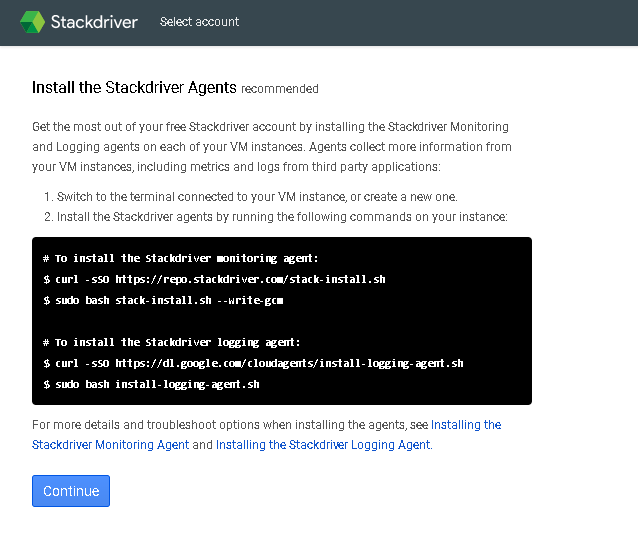
Install stackdriver:
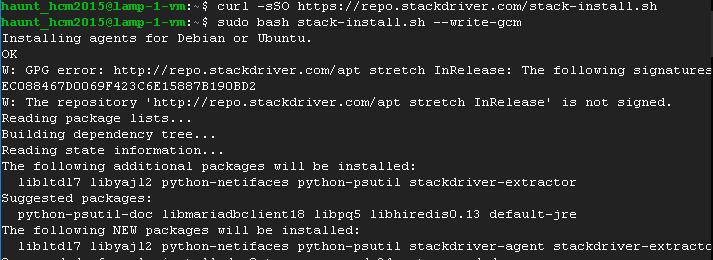
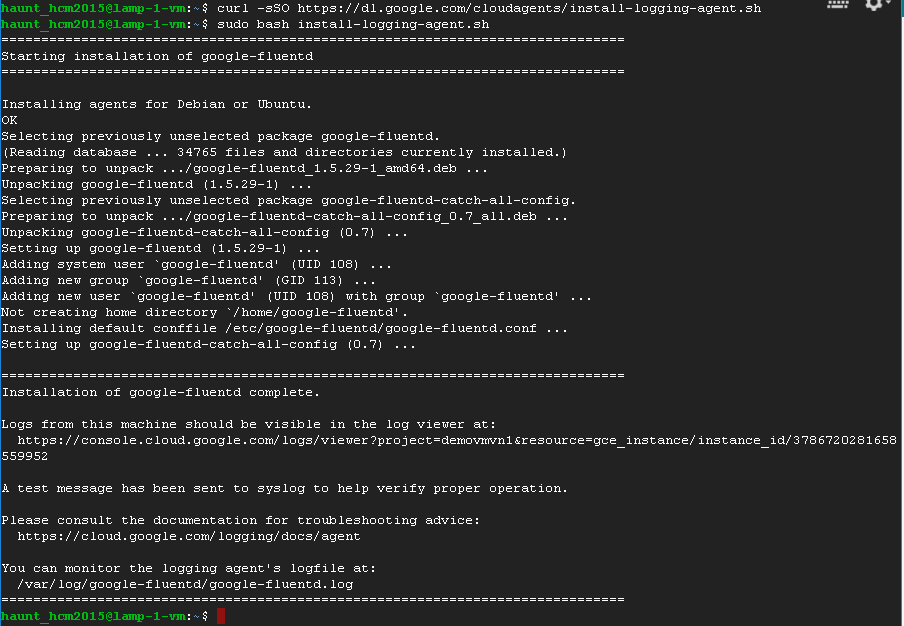
Continue installing:

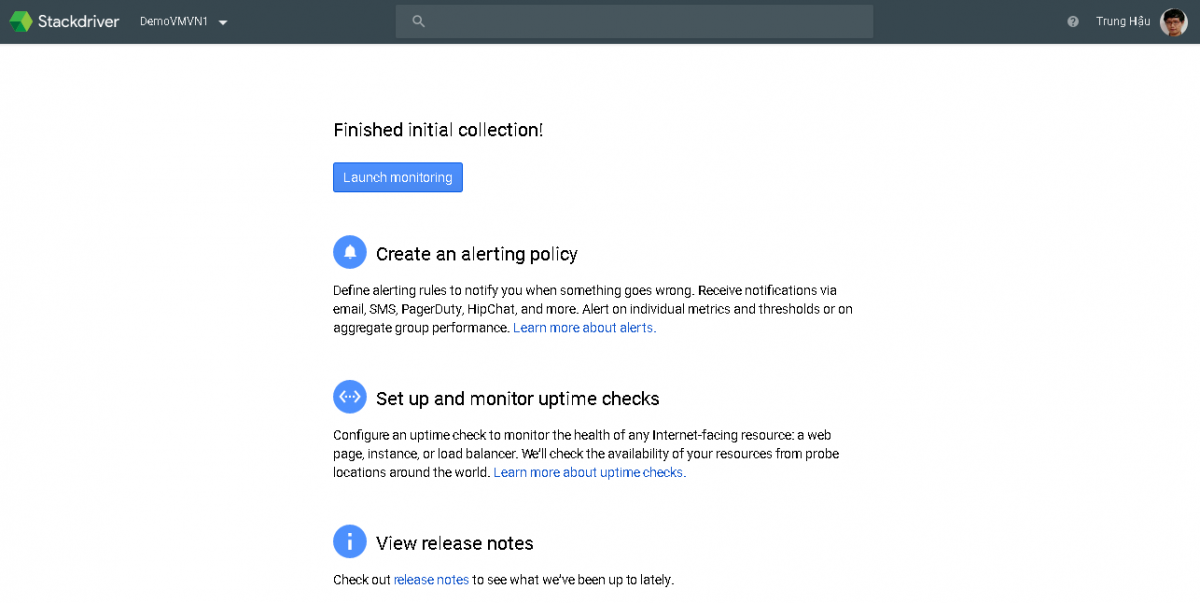
Click launch mornitor. A pop-up message will inform you that your account is in a free trial. Click Continue with the trial.
You see your Stackdriver account dashboard. Close the "Welcome to Stackdriver" banner.
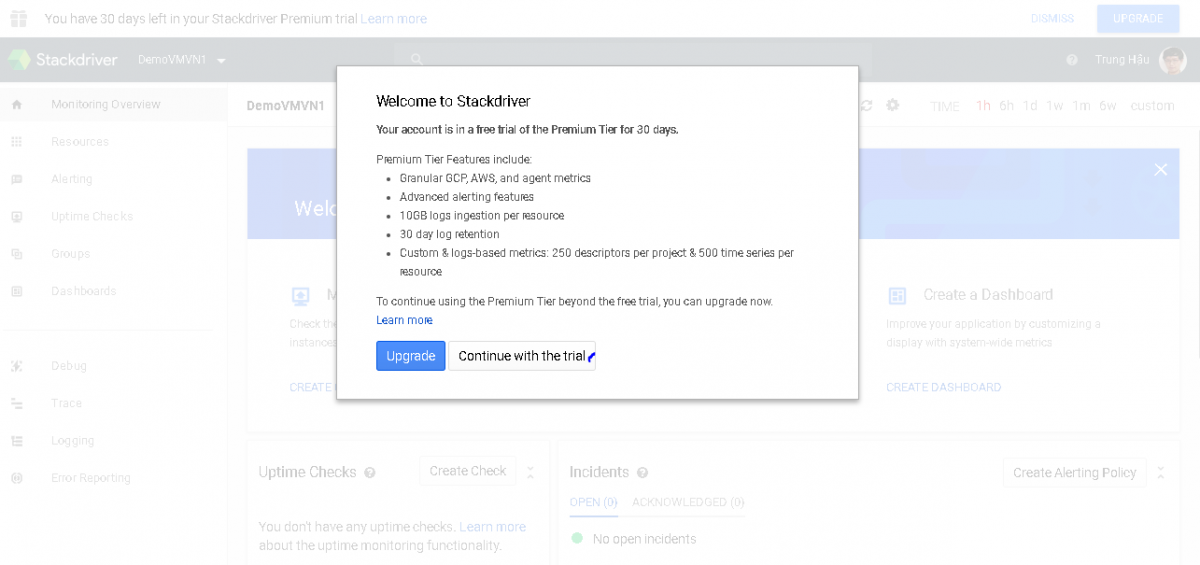
Dashboard Stackdriver:

5. Create an uptime check and an alerting policy
Uptime Checks verify that your web server is always accessible. The alerting policy controls who is notified if the uptime checks should fail.
On the Stackdriver tab click Create an Uptime Check button on the dashboard. You can also go to Uptime Checks in the left-hand menu, then select Uptime Checks Overview and then click Create an Uptime Check on the new page.
Edit the New Uptime Check panel by editing the following fields:
- Title: Lamp Uptime Check
- Check type: HTTP
- Resource Type: Instance
- Applies To: Single, lamp-1-vm
- Check every: 1 min
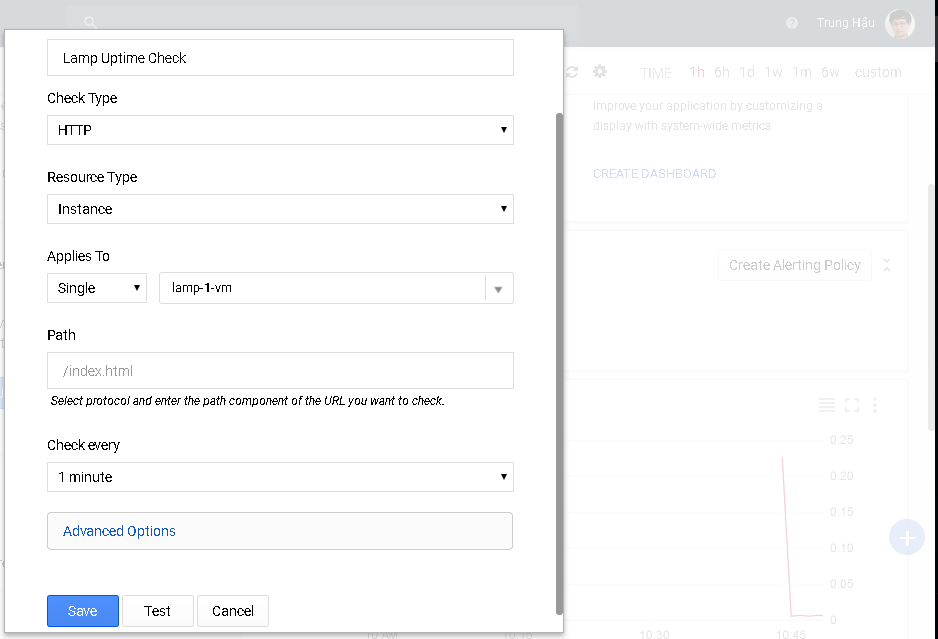
Click Test to verify your uptime check is working.
If you see
Connection error - refused
a message, you might have not installed the Apache HTTP Server. For other errors, see Uptime checks.
I have error when tested:
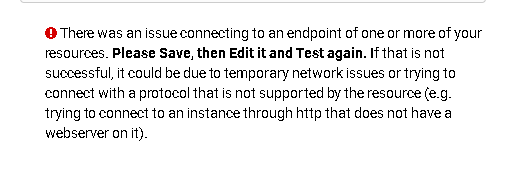
Don't worry, you can press save and create Create Alerting Policy.
When you see a green check mark everything is running correctly. Click Save.
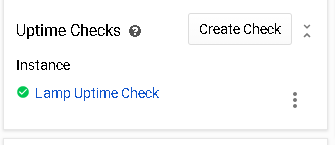
You see the following panel in dasbboard -- click Create Alerting Policy:

Update the Alerting Policy this way:
- The Conditions section is already set up. You don't have to change it.
- In the Notifications section, click Add Notification and fill in your personal email address. You will need to check it for the notification.
- In the Documentation section, click Add Documentation and enter: Stackdriver LAMP gettting started example
- In the Name this policy section, you can accept the default: Uptime Check Policy

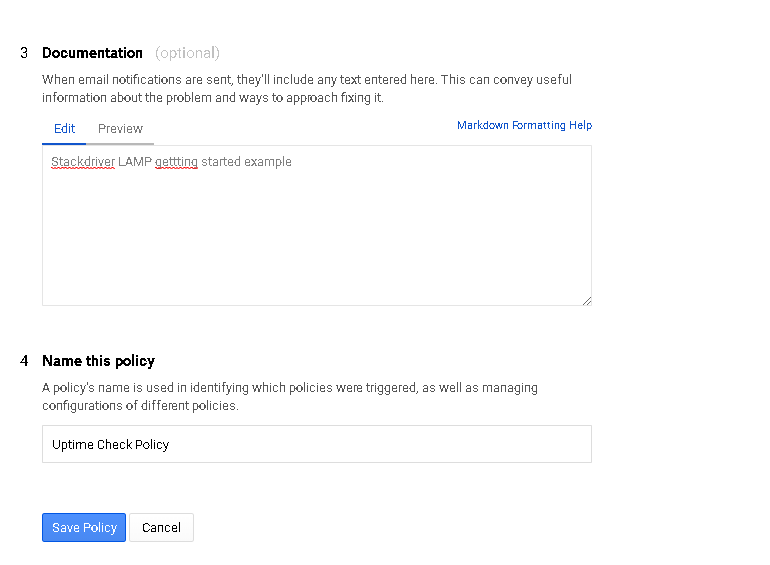
Click Save Policy.
The Dashboard will now have your Uptime Check added to it.
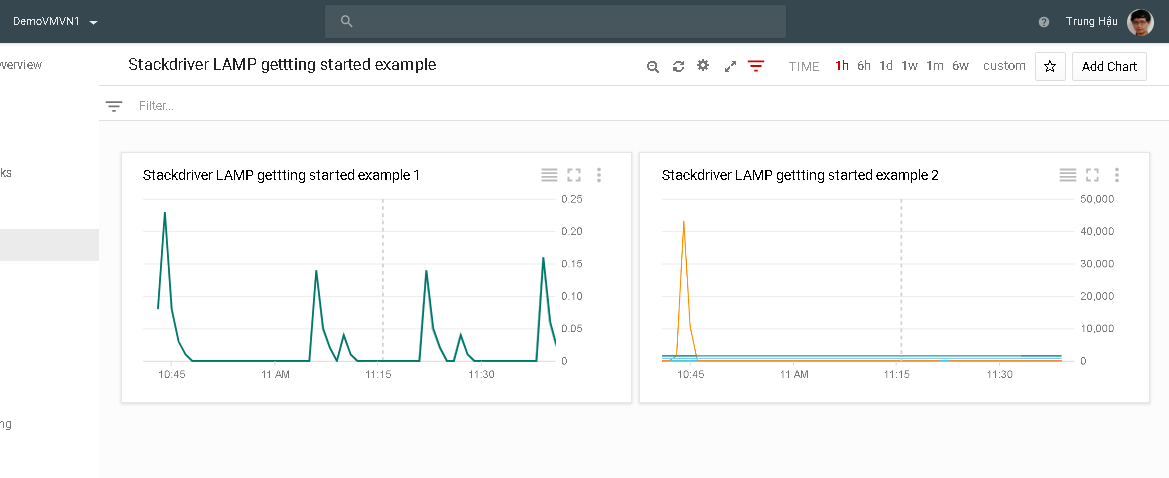
6. Create a dashboard and chart
Display the metrics collected by Stackdriver Monitoring in your own charts and dashboards. Now you'll create the charts for the lab metrics and a custom dashboard.
In the left-hand menu of Stackdriver Monitoring Console, select Dashboards > Create Dashboard.
Click Add Chart.
Click into the Find resource type and metric field and start typing "CPU", then select CPU Load (1m).
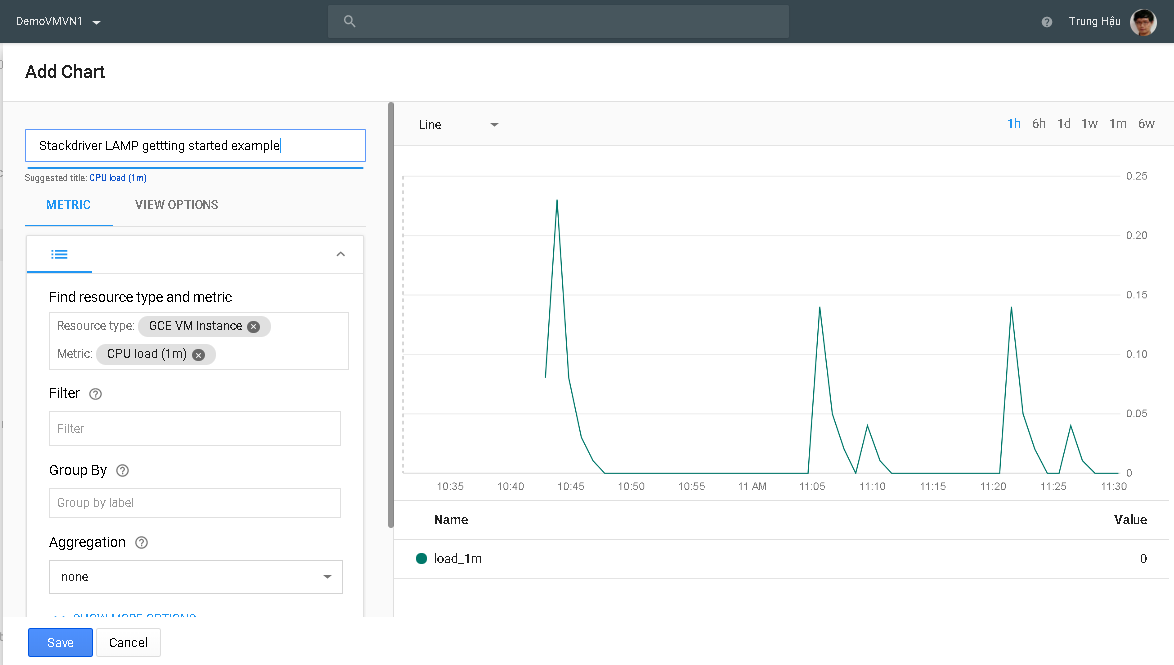
You will automatically have GCE VM instance selected as the Resource type. The chart will name itself after the metric you're using, but you can rename it whatever you want.
Click Save.
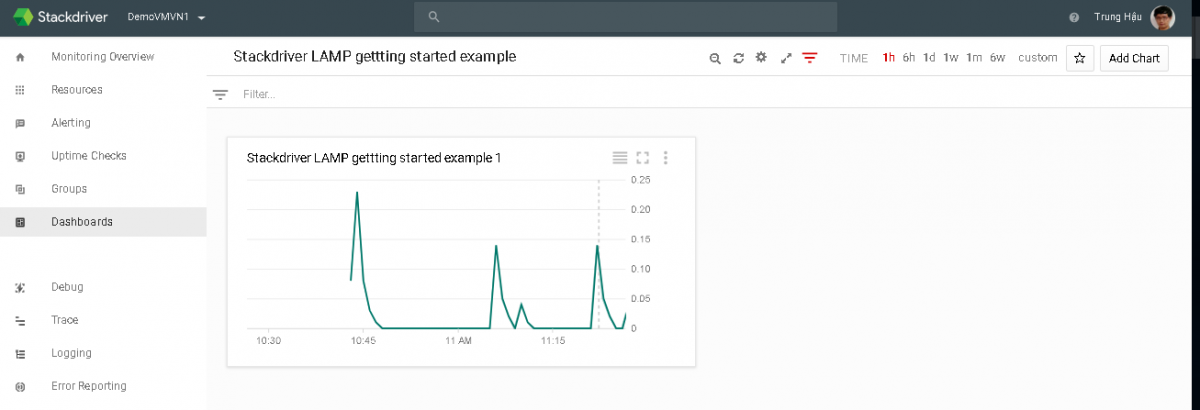
Now create a second chart.
Select Add Chart in the upper-right menu of the new dashboard.
In the field start typing "Network", then choose "Received Packets". Leave the other fields with their default values. You see the chart data in the Preview section.
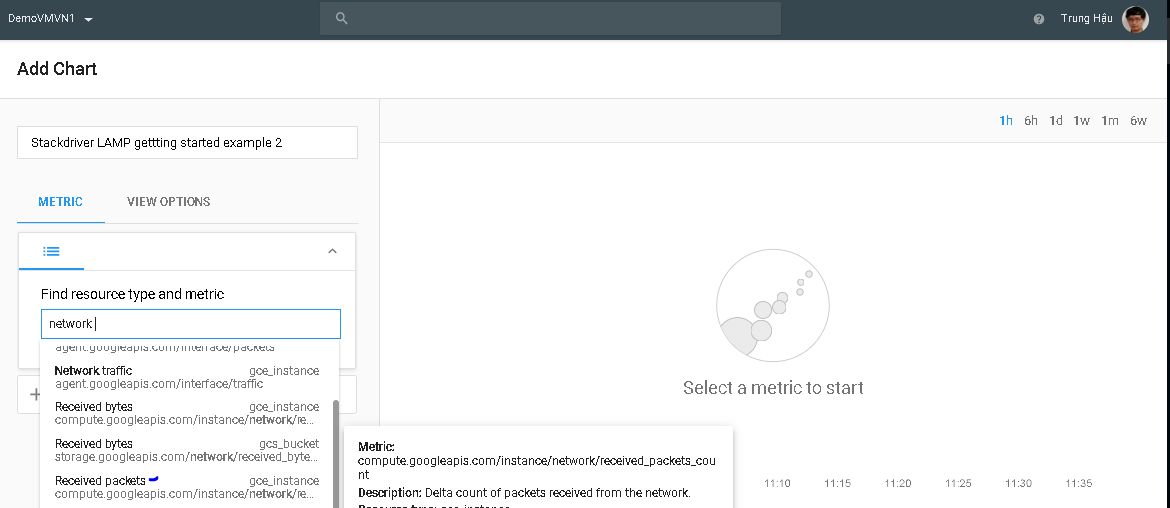
Click Save.
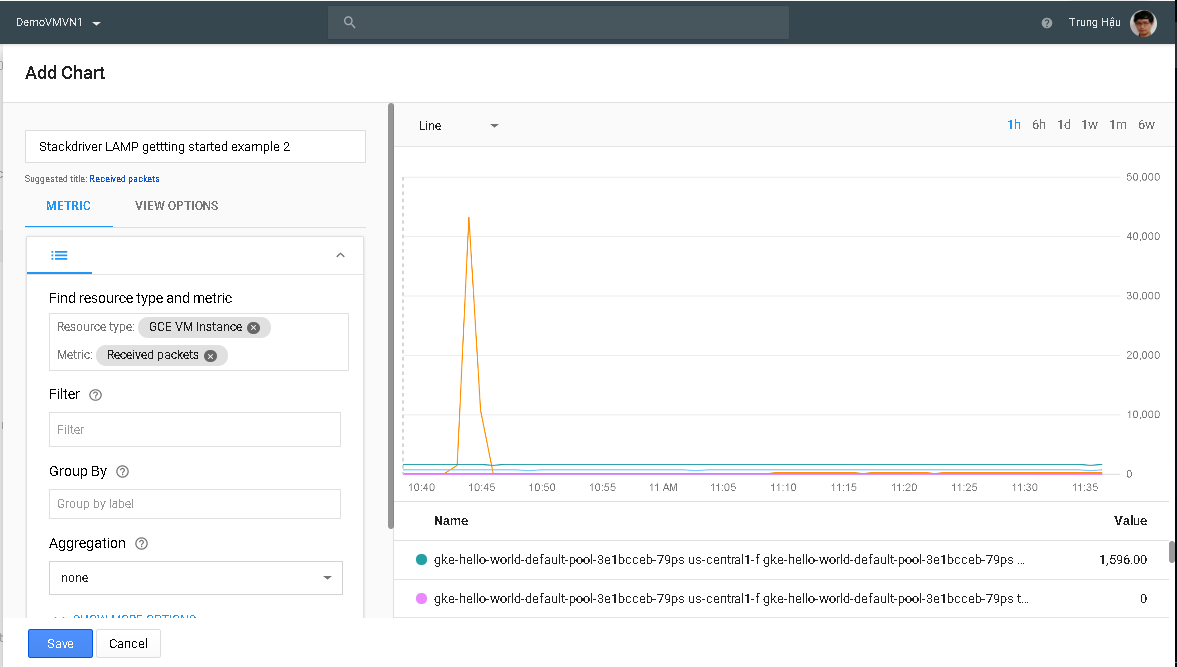
You still need to name your new Dashboard! Change Untitled Dashboard to Stackdriver LAMP gettting started example
7. Test the check and alert
To test the Check and Alert, go back to the Console tab and the VM Instances page. Click on your instance, and click Stop from the top menu.

After stopped and wait several minute to start:

You might wait up to five minutes for the next uptime check to fail. The alert and notification will happen when the next failure occurs.
After a couple of minutes, correct the "problem" by returning to the VM Instances page in the Console, select your instance, and click Start from the top menu.

Note: Remember that the uptime check runs once per minute, so if you turn your machine back on in under a minute, it won't violate your uptime policy and you won't see the alert.
You'll see an Incident notice on the Monitoring Overview page on Stackdriver.

The alert email notification will look something like this:

8. View your logs
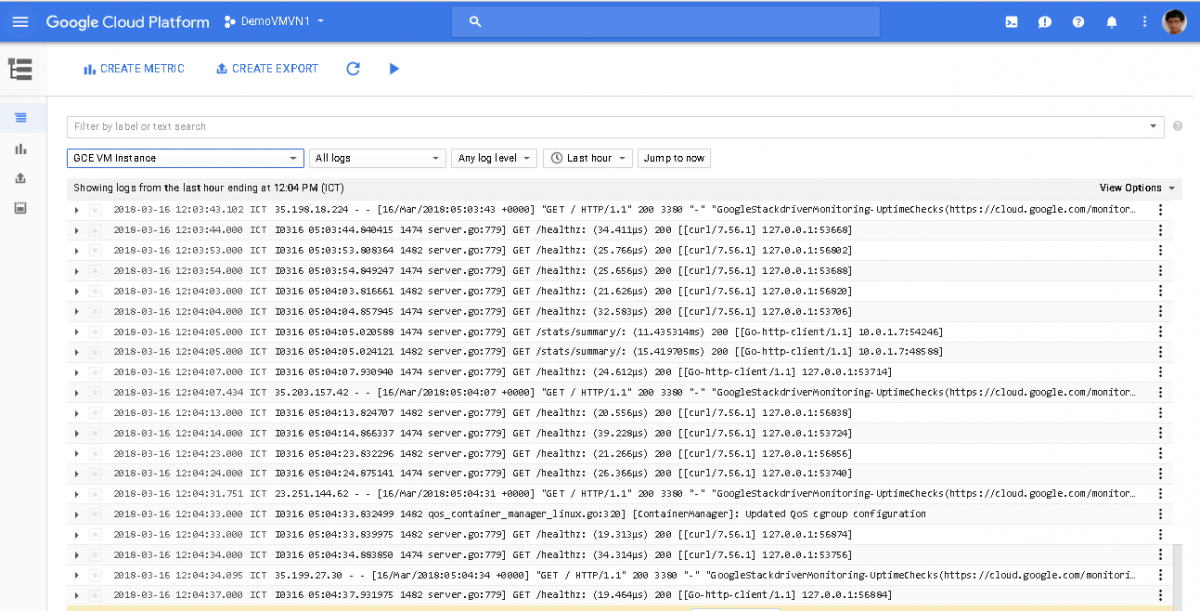
Stackdriver Monitoring and Stackdriver Logging are closely integrated. Let's check out the logs for your lab.
In the Stackdriver left-hand menu, click Logging to see the Logs Viewer. Now change the focus to see the logs you want:
- Select GCE VM Instance in the first drop-down menu.
- Select syslog in the second drop-down menu, and click OK.
- Leave the other fields with their default values.
You see the logs from your VM instance:
9. References Document:
[1] Stackdriver Documentation: https://cloud.google.com/stackdriver/docs/
[2] Stackdriver: Qwik Start
All rights reserved