MPAndroidChart and Example
Bài đăng này đã không được cập nhật trong 6 năm
MPAndroidChart là một thư viện biểu đồ mạnh mẽ và dễ sử dụng cho Android. Nó support việc vẽ biểu đồ, chia tỷ lệ và xử lí animations trong Chart
I. Basic Setup
phần này mình sẽ nói khái quát các bước cơ bản để setup thư viện này
Add dependency
Gradle recommend nên sử dụng thư viện để add dependency
repositories {
    maven { url 'https://jitpack.io' }
}
dependencies {
    implementation 'com.github.PhilJay:MPAndroidChart:v3.1.0'
}
Creating the View
<com.github.mikephil.charting.charts.LineChart
        android:id="@+id/chart"
        android:layout_width="match_parent"
        android:layout_height="match_parent" />
Mình sẽ chủ yếu nói về cách xây dựng một LineChart nhưng ngoài ra còn có một số biểu đồ khác như BarChart, SCatterChart, CandleStickerChart, PieChart
Bước tiếp theo khai báo trong Activity hoặc Fragment mà bạn muốn hiển thị
   // in this example, a LineChart is initialized from xml
    LineChart chart = (LineChart) findViewById(R.id.chart);
Adding Data
Sau khi khai báo xong instance của LineChart, tiếp theo tạo data và thêm nó vào biểu đồ.
để thêm data bạn cần phải gói dữ liệu và đưa nó vào trong một đối tượng gọi là Entry như trong đoạn code sau
YourData[] dataObjects = ...;
List<Entry> entries = new ArrayList<Entry>();
for (YourData data : dataObjects) {
    // turn your data into Entry objects
    entries.add(new Entry(data.getValueX(), data.getValueY()));
}
sau đó add List<Entry> đã tạo vào đối tượng LineDataSet.. Đối tượng này sẽ giữ data và cho phép tạo kiểu dữ liệu riêng cho data đó. Một số method cho việc cài đặt màu sắc kiểu chữ, ...
LineDataSet dataSet = new LineDataSet(entries, "Label"); // add entries to dataset
dataSet.setColor(...);
dataSet.setValueTextColor(...); // styling, ...
Bước cuối cùng, bạn cần thêm đối tượng LineDataSet bạn đã tạo vào đối tượng LineData. Đối tượng này chứa tất cả dữ liệu biểu thị cho Chart và cho phép tạo thêm các hình dáng khác cho biểu đồ . Sau khi tạo đối tượng dữ liệu, bạn có thể setup với một số method sau
LineData lineData = new LineData(dataSet);
chart.setData(lineData);
chart.invalidate(); // refresh
Styling(Tạo kiểu)
Phần này tập trung vào cài đặt và tạo kiểu dáng cho Chart. Thư viện này áp dụng cho tất cả các loại Biểu đồ.
Refreshing(cho việc àm mới) có 2 method hỗ trợ cho việc này là invalidate() và notifyDataSetChanged()
invalidate(): method này đc gọi khi redraw biểu đồ. (xem những thay đổi trên biều đồ)
notifyDataSetChanged() : Cho phép biểu đồ biết dữ liệu cơ bản của nó đã thay đổi và thực hiện tất cả các phép tính toán lại cần thiết (offset, chú thích, min, max, ...). Điều này là cần thiết đặc biệt là khi thêm dữ liệu động.
Logging (log lịch sử)
setLogEnabled(boolean enabled) : khi set True sẽ kích hoạt logcat biểu đồ. Tuy nhiên điều này sẽ gây ảnh hưởng đến hiệu năng khi làm việc vì vậy khi không cần thiết thì bạn ko nên dùng nó.
Biểu đồ tổng quát :
Dưới đây là một vài method chung thường đc sử dụng cho việc tạo kiểu dáng biểu đồ
setBackgroundColor(int color): set màu background bao phủ toàn bộ Chart, ngoài ra backgroundColor có thể set trong xml
setDescription(String desc): hiển thị text mô tả sẽ xuẩt hiện ở góc phải dưới của biểu đồ
setDescriptionColor(int color) : set màu cho text description
setDescriptionPosition(float x, float y): custom vị trí cho description text bằng pixel
setDescriptionTypeface(Typeface t): set TypeFace sử dụng cho việc vẽ description text
setDescriptionTextSize(float size): set kích thước Description text bằng pixel
setNoDataText(String text) : Set text sẽ xuất hiện khi biều đồ trống
setDrawGridBackground(boolean enabled) : nếu nó đc enable thì hình chữ nhật nền phía sau vùng biểu đồ sẽ được vẽ.
setDrawBorders(boolean enabled): Enable/disable chart bolders (các đường bao quanh biểu đồ)
setBorderColor(int color) : Set màu cho chart bolders
setBorderWidth(float width): set bề dầy đường bao quanh biểu đồ bằng dp
setMaxVisibleValueCount(int count): đặt số lượng lable xuẩt hiện tối đa trên biểu đồ
II. Example
Để chi tiết hơn các bạn xem qua ví dụ sau nhé
1. activity_main.xml
<?xml version="1.0" encoding="utf-8"?>
<LinearLayout xmlns:android="http://schemas.android.com/apk/res/android"
    xmlns:tools="http://schemas.android.com/tools"
    android:layout_width="match_parent"
    android:layout_height="match_parent"
    android:gravity="center"
    android:orientation="vertical"
    tools:context="com.javapapers.androidchartapp.MainActivity">

    <Button
        android:id="@+id/btnBarChart"
        android:layout_width="match_parent"
        android:layout_height="wrap_content"
        android:layout_margin="10dp"
        android:text="Bar Chart Demo" />

    <Button
        android:id="@+id/btnPieChart"
        android:layout_width="match_parent"
        android:layout_height="wrap_content"
        android:layout_margin="10dp"
        android:text="Pie Chart Demo" />

</LinearLayout>
Tiếp theo tạo một activity là BarChartActivity
2. activity_bar_chart.xml
thêm đoạn code dưới đây
<?xml version="1.0" encoding="utf-8"?>
<LinearLayout xmlns:android="http://schemas.android.com/apk/res/android"
    xmlns:tools="http://schemas.android.com/tools"
    android:layout_width="match_parent"
    android:layout_height="match_parent"
    android:orientation="vertical">

    <com.github.mikephil.charting.charts.BarChart
        android:id="@+id/barchart"
        android:layout_width="match_parent"
        android:layout_height="match_parent"/>

</LinearLayout>
Khởi tạo một Activity
Khởi tạo một activity có tên là PieChartActivity
3. activity_pie_chart.xml
<?xml version="1.0" encoding="utf-8"?>
<LinearLayout xmlns:android="http://schemas.android.com/apk/res/android"
    xmlns:app="http://schemas.android.com/apk/res-auto"
    xmlns:tools="http://schemas.android.com/tools"
    android:layout_width="match_parent"
    android:layout_height="match_parent">

    <com.github.mikephil.charting.charts.PieChart
        android:id="@+id/piechart"
        android:layout_width="match_parent"
        android:layout_height="match_parent" />
</LinearLayout>
4. MainActivity
Tại đây sẽ tạo 2 button và setClick cho chúng
package com.javapapers.androidchartapp;

import android.content.Intent;
import android.support.v7.app.AppCompatActivity;
import android.os.Bundle;
import android.view.View;
import android.widget.Button;

import com.github.mikephil.charting.charts.BarChart;

public class MainActivity extends AppCompatActivity {
   Button btnBarChart, btnPieChart;

   @Override
   protected void onCreate(Bundle savedInstanceState) {
       super.onCreate(savedInstanceState);
       setContentView(R.layout.activity_main);
       BarChart barChart = (BarChart) findViewById(R.id.barchart);

       btnBarChart = findViewById(R.id.btnBarChart);
       btnPieChart = findViewById(R.id.btnPieChart);
       btnBarChart.setOnClickListener(new View.OnClickListener() {
           @Override
           public void onClick(View view) {
               Intent I = new Intent(MainActivity.this, BarChartActivity.class);
               startActivity(I);
           }
       });
       btnPieChart.setOnClickListener(new View.OnClickListener() {
           @Override
           public void onClick(View view) {
               Intent I = new Intent(MainActivity.this, PieChartActivity.class);
               startActivity(I);
           }
       });
   }
}
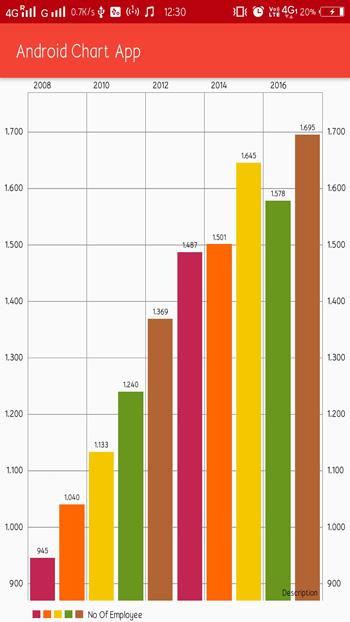
5. BarChartActivity
Chúng ta cần add data vào Android chart bằng cách sử dụng 2 ArrayList, một cho năm (x-axis) và một cho cho số lượng nhân viên (y-axis). Để chuyển data cho android Chart chúng ta cần một tập data set trong đó 2 ArrayList chính là 2 tham số truyền vào
package com.javapapers.androidchartapp;

import android.support.v7.app.AppCompatActivity;
import android.os.Bundle;

import com.github.mikephil.charting.charts.BarChart;
import com.github.mikephil.charting.data.BarData;
import com.github.mikephil.charting.data.BarDataSet;
import com.github.mikephil.charting.data.BarEntry;
import com.github.mikephil.charting.interfaces.datasets.IBarDataSet;
import com.github.mikephil.charting.utils.ColorTemplate;

import java.util.ArrayList;

public class BarChartActivity extends AppCompatActivity {

    @Override
    protected void onCreate(Bundle savedInstanceState) {
        super.onCreate(savedInstanceState);
        setContentView(R.layout.activity_bar_chart);
        BarChart chart = findViewById(R.id.barchart);

        ArrayList NoOfEmp = new ArrayList();

        NoOfEmp.add(new BarEntry(945f, 0));
        NoOfEmp.add(new BarEntry(1040f, 1));
        NoOfEmp.add(new BarEntry(1133f, 2));
        NoOfEmp.add(new BarEntry(1240f, 3));
        NoOfEmp.add(new BarEntry(1369f, 4));
        NoOfEmp.add(new BarEntry(1487f, 5));
        NoOfEmp.add(new BarEntry(1501f, 6));
        NoOfEmp.add(new BarEntry(1645f, 7));
        NoOfEmp.add(new BarEntry(1578f, 8));
        NoOfEmp.add(new BarEntry(1695f, 9));

        ArrayList year = new ArrayList();

        year.add("2008");
        year.add("2009");
        year.add("2010");
        year.add("2011");
        year.add("2012");
        year.add("2013");
        year.add("2014");
        year.add("2015");
        year.add("2016");
        year.add("2017");

        BarDataSet bardataset = new BarDataSet(NoOfEmp, "No Of Employee");
        chart.animateY(5000);
        BarData data = new BarData(year, bardataset);
        bardataset.setColors(ColorTemplate.COLORFUL_COLORS);
        chart.setData(data);
    }
}
6. PieChartActivty.java
package com.javapapers.androidchartapp;

import android.support.v7.app.AppCompatActivity;
import android.os.Bundle;

import com.github.mikephil.charting.charts.PieChart;
import com.github.mikephil.charting.data.BarEntry;
import com.github.mikephil.charting.data.Entry;
import com.github.mikephil.charting.data.PieData;
import com.github.mikephil.charting.data.PieDataSet;
import com.github.mikephil.charting.formatter.PercentFormatter;
import com.github.mikephil.charting.utils.ColorTemplate;

import java.util.ArrayList;

public class PieChartActivity extends AppCompatActivity {

    @Override
    protected void onCreate(Bundle savedInstanceState) {
        super.onCreate(savedInstanceState);
        setContentView(R.layout.activity_pie_chart);
        PieChart pieChart = findViewById(R.id.piechart);
        ArrayList NoOfEmp = new ArrayList();

        NoOfEmp.add(new Entry(945f, 0));
        NoOfEmp.add(new Entry(1040f, 1));
        NoOfEmp.add(new Entry(1133f, 2));
        NoOfEmp.add(new Entry(1240f, 3));
        NoOfEmp.add(new Entry(1369f, 4));
        NoOfEmp.add(new Entry(1487f, 5));
        NoOfEmp.add(new Entry(1501f, 6));
        NoOfEmp.add(new Entry(1645f, 7));
        NoOfEmp.add(new Entry(1578f, 8));
        NoOfEmp.add(new Entry(1695f, 9));
        PieDataSet dataSet = new PieDataSet(NoOfEmp, "Number Of Employees");

        ArrayList year = new ArrayList();

        year.add("2008");
        year.add("2009");
        year.add("2010");
        year.add("2011");
        year.add("2012");
        year.add("2013");
        year.add("2014");
        year.add("2015");
        year.add("2016");
        year.add("2017");
        PieData data = new PieData(year, dataSet);
        pieChart.setData(data);
        dataSet.setColors(ColorTemplate.COLORFUL_COLORS);
        pieChart.animateXY(5000, 5000);
    }
}
7. Kết quả

All rights reserved
