Easy to list Kubernetes resource requests and limits with kube-capacity (English)
Bài đăng này đã không được cập nhật trong 3 năm
Bài viết tiếng việt - Liệt kê tài nguyên requests, limits trong Kubernetes một cách dễ dàng với kube-capacity CLI
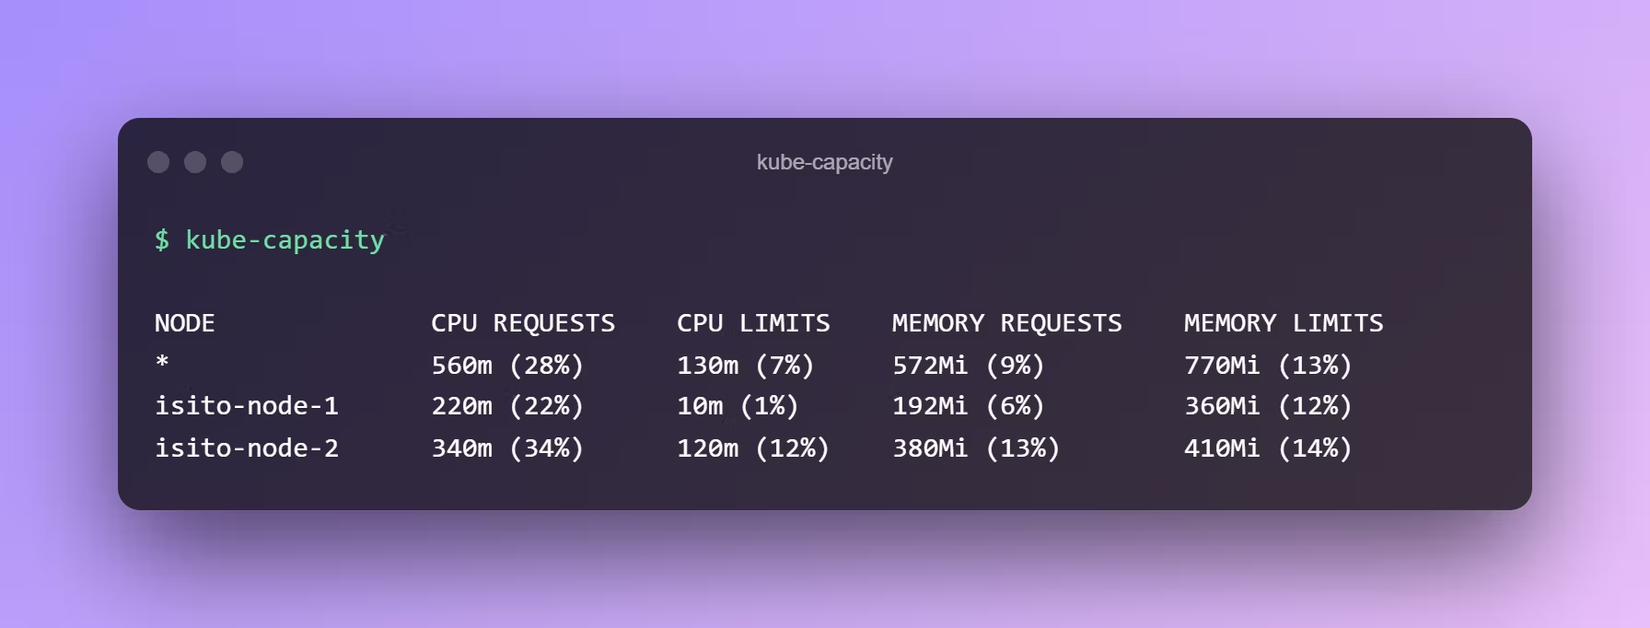
When we work with Kubernetes, to check the resource requests and limits we will use kubectl describe, and to check the utilization of the resources we will use kubectl top. Today we will talk about the kube-capacity CLI that combines the two CLI above and provides an overview of the resource requests, limits, and utilization.
For example, the illustration.

Installation
On macOS, this project can be installed with Homebrew:
brew tap robscott/tap
brew install robscott/tap/kube-capacity
On Linux, we go to the releases page and select the appropriate Linux Package, for example with me:
curl -fsSLO https://github.com/robscott/kube-capacity/releases/download/v0.7.1/kube-capacity_0.7.1_Linux_x86_64.tar.gz
tar zxvf kube-capacity_0.7.1_Linux_x86_64.tar.gz
Move to one of the directories located in $PATH:
sudo mv kube-capacity /usr/local/bin/
Check if we have installed it successfully:
kube-capacity -h
...

Flags:
  -a, --available                 includes quantity available instead of percentage used
  -c, --containers                includes containers in output
      --context string            context to use for Kubernetes config
  -h, --help                      help for kube-capacity
      --kubeconfig string         kubeconfig file to use for Kubernetes config
  -n, --namespace string          only include pods from this namespace
      --namespace-labels string   labels to filter namespaces with
      --node-labels string        labels to filter nodes with
  -o, --output string             output format for information (supports: [table json yaml]) (default "table")
      --pod-count                 includes pod count per node in output
  -l, --pod-labels string         labels to filter pods with
  -p, --pods                      includes pods in output
      --sort string               attribute to sort results be (supports: [cpu.util cpu.request cpu.limit mem.util mem.request mem.limit name]) (default "name")
  -u, --util                      include
Usage
By default, kube-capacity will output a list of nodes with the total CPU and Memory resource requests and limits for all the pods running on them.
Default
For clusters with more than one node, the first line will also include cluster wide totals.
kube-capacity
NODE              CPU REQUESTS    CPU LIMITS    MEMORY REQUESTS    MEMORY LIMITS
*                 560m (28%)      130m (7%)     572Mi (9%)         770Mi (13%)
isito-node-1      220m (22%)      10m (1%)      192Mi (6%)         360Mi (12%)
isito-node-2      340m (34%)      120m (12%)    380Mi (13%)        410Mi (14%)
Including Pods
For more detailed output about the requests and limits of each Pod, add the flags --pods or -p to kube-capacity.
kube-capacity -p
NODE            NAMESPACE      POD                                CPU REQUESTS    CPU LIMITS    MEMORY REQUESTS    MEMORY LIMITS
*               *              *                                  560m (28%)      780m (38%)    572Mi (9%)         770Mi (13%)

isito-node-1    *              *                                  220m (22%)      320m (32%)    192Mi (6%)         360Mi (12%)
isito-node-1    istio-system   istio-egressgateway-lwc6z          100m (10%)      200m (20%)    100Mi (3%)         200Mi (7%)
isito-node-1    istio-system   istio-ingressgateway-7b5bcb98f8    120m (12%)      120m (12%)    92Mi (3%)          160Mi (5%)

isito-node-2    *             *                                   340m (34%)      460m (46%)    380Mi (13%)        410Mi (14%)
isito-node-2    kube-system   kube-proxy-3ki7                     200m (20%)      280m (28%)    210Mi (7%)         210Mi (7%)
isito-node-2    tiller        tiller-deploy                       140m (14%)      180m (18%)    170Mi (5%)         200Mi (7%)
Filtering By Namespace
To list by namespace, we use the flags --namespace or -n
kube-capacity -p -n istio-system
NODE            NAMESPACE      POD                                CPU REQUESTS    CPU LIMITS    MEMORY REQUESTS    MEMORY LIMITS
isito-node-1    *              *                                  220m (22%)      320m (32%)    192Mi (6%)         360Mi (12%)
isito-node-1    istio-system   istio-egressgateway-lwc6z          100m (10%)      200m (20%)    100Mi (3%)         200Mi (7%)
isito-node-1    istio-system   istio-ingressgateway-7b5bcb98f8    120m (12%)      120m (12%)    92Mi (3%)          160Mi (5%)
Including Utilization
In case we need to check the utilization of the resources, we use the flags --util or -u.
Note: It's important to note that this output relies on metrics-server functioning correctly in your cluster.
kube-capacity --util
NODE            CPU REQUESTS    CPU LIMITS    CPU UTIL    MEMORY REQUESTS    MEMORY LIMITS   MEMORY UTIL
*               560m (28%)      130m (7%)     40m (2%)    572Mi (9%)         770Mi (13%)     470Mi (8%)
isito-node-1    220m (22%)      10m (1%)      10m (1%)    192Mi (6%)         360Mi (12%)     210Mi (7%)
isito-node-2    340m (34%)      120m (12%)    30m (3%)    380Mi (13%)        410Mi (14%)     260Mi (9%)
Sorting
To highlight the nodes, pods, and containers with the highest metrics, you can sort by a variety of columns:
kube-capacity --util --sort cpu.util
NODE            CPU REQUESTS    CPU LIMITS    CPU UTIL    MEMORY REQUESTS    MEMORY LIMITS   MEMORY UTIL
*               560m (28%)      130m (7%)     40m (2%)    572Mi (9%)         770Mi (13%)     470Mi (8%)
isito-node-2    340m (34%)      120m (12%)    30m (3%)    380Mi (13%)        410Mi (14%)     260Mi (9%)
isito-node-1    220m (22%)      10m (1%)      10m (1%)    192Mi (6%)         360Mi (12%)     210Mi (7%)
Conclusion
This is a helpful tool when we need quickly check resource requests and limits.
All rights reserved