Churn Customer Prediction
Bài đăng này đã không được cập nhật trong 2 năm

High-level overview:
In unraveling this intricate problem, we delve into a detailed examination of Sparkify's data to decipher underlying patterns and insights crucial for predicting customer churn. Sparkify, a digital music service akin to industry behemoths like Spotify and YouTube Music, offers a diverse user experience, spanning subscription-based models, ad-supported free tiers, and features like playlist curation and social connections.
Problem domain:
In this project, the main problem is apply my knowledge about data analysis and use some ML model to predict customer churn. This is one well-known domain on data science: Predict Customer Churn.
A strategy for solving the problem
To predict customer churn, firstly, I need define the main domain and main problem to focus solve. Next, I need basic analysis to perform preprocessing or other method to understand clearly about the dataset. After I have some description for data, I will EDA and perform feature engineering to extract some key features for train model step. After that, I will train some models to determine which one is most effective at predicting customer churn. Some model maybe use like: Logistic Regression, Logistic SVM, Random Forest, Gradient Boosting. And finally, I will perform some advance method to enhance the accuracy for model validate.
Description of Input Data:
The information root dataframe: 286500 rows and 18 columns.
Statictis about amount null and empty value for each columns in dataframe:
- With column artist have 58392 null values and have 0 empty value
- With column auth have 0 null values and have 0 empty value
- With column firstName have 8346 null values and have 0 empty value
- With column gender have 8346 null values and have 0 empty value
- With column itemInSession have 0 null values and have 0 empty value
- With column lastName have 8346 null values and have 0 empty value
- With column length have 58392 null values and have 0 empty value
- With column level have 0 null values and have 0 empty value
- With column location have 8346 null values and have 0 empty value
- With column method have 0 null values and have 0 empty value
- With column page have 0 null values and have 0 empty value
- With column registration have 8346 null values and have 0 empty value
- With column sessionId have 0 null values and have 0 empty value
- With column song have 58392 null values and have 0 empty value
- With column status have 0 null values and have 0 empty value
- With column ts have 0 null values and have 0 empty value
- With column userAgent have 8346 null values and have 0 empty value
- With column userId have 0 null values and have 8346 empty value
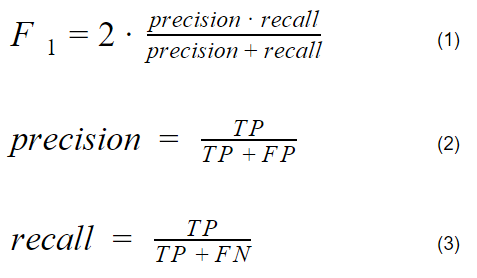
Metric to evaluate
Since the churned users are a fairly small subset, I will use F1 score as the metric to optimize. This is the calculation formula:
Modeling
- Logistic Regression
An approach that is frequently used for binary classification jobs is logistic regression. It uses a logistic function to create a link between the likelihood of the target class and the input characteristics. Maximum likelihood estimate forms the basis of logistic regression. The logarithm of the target class's probabilities and the input attributes are assumed to have a linear connection. The approach transfers the linear combination of features to a probability value between 0 and 1 by using the logistic function. A few presumptions underpin logistic regression. It is predicated on the idea that, when expressed on a log-odds scale, the connection between the attributes and the target class is linear. Moreover, it presumes that the characteristics are not multicollinear and that the observations are independent of one another.
- Random Forest
A machine learning technique called Random Forest uses many decision trees together to generate predictions. To get the final result, each tree is trained on a different portion of the data, and their average predictions are then averaged. Using the combined knowledge of all the individual trees, this method—known as ensemble learning—increases overall robustness and accuracy. By randomly picking characteristics during tree building and sampling the data, Random Forest provides unpredictability to prevent overfitting. The "wisdom of the crowd" theory, which holds that combining predictions from several sources produces superior results, serves as the basis for Random Forest. Compared to a single decision tree, Random Forest can produce more precise and dependable outcomes by integrating the predictions of several decision trees
Random Forest does not mainly rely on presumptions about the distribution of the data, in contrast to certain other techniques. It is adaptable to many dataset types since it can handle both numerical and categorical variables. Random Forest is robust in the face of difficult data examples since it also shows resilience to noise and outliers. The number of trees in the forest (n_estimators), the maximum depth of a tree (max_depth), and the amount of features taken into consideration for the optimum split at each node (max_features) are crucial parameter choices when utilizing Random Forest. To get the best possible model performance, these parameters may be adjusted using methods like cross-validation to balance computing efficiency and accuracy.
- Gradient Boosting
Gradient Boosting is an ensemble learning technique that builds a strong predictive model by successively combining several weak predictive models, often decision trees. Its primary objective is to gradually fix the faults committed by the earlier models, with an emphasis on lowering residual errors. The basic idea behind gradient boosting is to add weak models iteratively in order to grow the ensemble. This is accomplished by use of gradient descent optimization, which modifies each weak model's parameters in order to minimize a certain loss function, such as log loss or mean squared error. Gradient Boosting is adaptable in handling both numerical and categorical information, in contrast to some other methods. It can handle noise and outliers with effectiveness and does not presume any particular data distribution. Gradient Boosting, however, is susceptible to overfitting if it is not appropriately regularized, hence it is crucial to exercise caution when doing so.
- Linear Support Vector Machine
An approach for binary classification called linear SVM determines the best hyperplane to divide the data into distinct groups. It seeks to increase the class margin to its maximum. Fundamentals: The goal of linear SVM is to locate the hyperplane that optimizes the margin between data points belonging to various classes. Using the kernel technique, it converts the input characteristics into a higher-dimensional space and locates the ideal separation hyperplane inside that space.
Assumptions: A hyperplane can be used to divide the data in linear SVM. When there is a distinct border or when the classes are linearly separable, it functions well. Outliers that are distant from the decision boundary have no effect on it. Parameter Settings: The regularization parameter © is the primary parameter of Linear SVM. A lower value of C permits a greater margin but raises the possibility of misclassifying certain training samples. A tighter margin may result from misclassification penalties that are increased with a higher value of C. The specific dataset and the trade-off between misclassification and margin size should be taken into consideration while selecting option C.
Hyperparameter Tuning:
In the Sparkify project, I aimed to optimize the performance of our machine learning model through a systematic process of hyperparameter tuning.
Grid Search:
For my hyperparameter tuning, I employed a grid search approach. This method involves defining a set of hyperparameter values to explore and systematically evaluating the model's performance for each combination of these values. This exhaustive search allows us to find the optimal hyperparameters within the specified ranges.
Selected Hyperparameters:
Below are the hyperparameters we tuned for each model:
Linear Support Vector Machine:
maxDepth: Maximum Tree Depth: 5 (default) Random Forest:
maxDepth: Maximum Tree Depth: 5 (default) Logistic Regression:
maxIter: Maximum number of iterations: 100 (default) elasticNetParam: ElasticNet mixing parameter: 0.0 (default) Gradient Boosting:
maxDepth: Maximum Tree Depth: 5 (default)
Rationale:
We chose to focus on these specific hyperparameters based on the characteristics of the selected model and their known impact on performance. While other hyperparameters may also influence the model, we prioritized those that are most likely to have a significant effect on the Sparkify dataset.
For the Linear Support Vector Machine and Random Forest models, we specifically targeted the maxDepth hyperparameter as it plays a crucial role in controlling the complexity of the model.
Logistic Regression was fine-tuned by adjusting both the maxIter and elasticNetParam parameters. The maxIter parameter controls the maximum number of iterations, while the elasticNetParam parameter balances between L1 and L2 regularization.
Gradient Boosting, like the other models, was tuned with a focus on the maxDepth hyperparameter, which determines the maximum depth of the individual trees in the ensemble.
Evaluation Metric:
To assess the performance of each model configuration during hyperparameter tuning, we used [insert your chosen evaluation metric], a metric well-suited for our classification task. This metric served as the guiding criterion to select the optimal set of hyperparameters.
Results:
The results of the hyperparameter tuning process revealed the following optimal configurations for each model:
Linear Support Vector Machine:
maxDepth: 5 Random Forest:
maxDepth: 5 Logistic Regression:
maxIter: 100 elasticNetParam: 0.0 Gradient Boosting:
maxDepth: 5 These configurations demonstrated the best performance on our chosen evaluation metric, providing a balance between model complexity and predictive accuracy.
Data Preprocessing:
In the dataset under consideration, there exists a set of records where all values associated with variables related to artists, song length, and specific songs are null. In making a deliberate decision, I have chosen not to discard these particular data points. The rationale behind this choice lies in the potential retention of valuable information regarding user behaviors, even in situations where users may not be actively participating in the act of listening to music. This strategic approach allows for the preservation of a comprehensive dataset, capturing nuances in user engagement beyond explicit music consumption, thereby contributing to a more holistic analysis of user interactions within the Sparkify platform.
EDA
Dataframe have 52 userId about churn group.
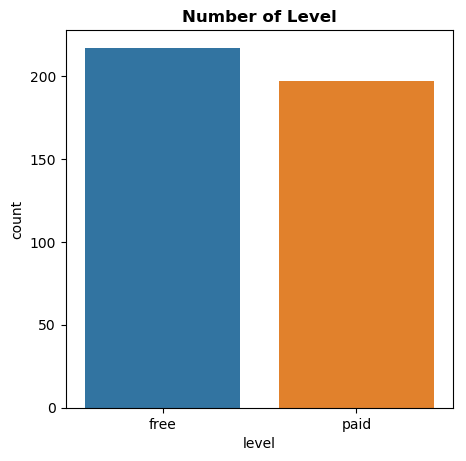
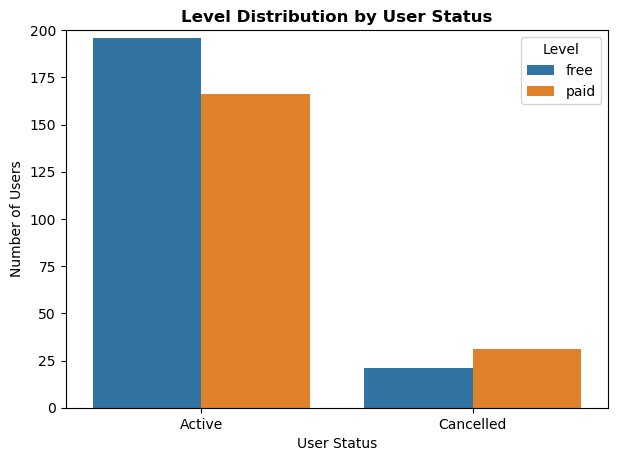
With the 'level' feature, there are two values: 'free' and 'paid.' In this context, the number of users with a 'free' level is higher than those with a 'paid' level
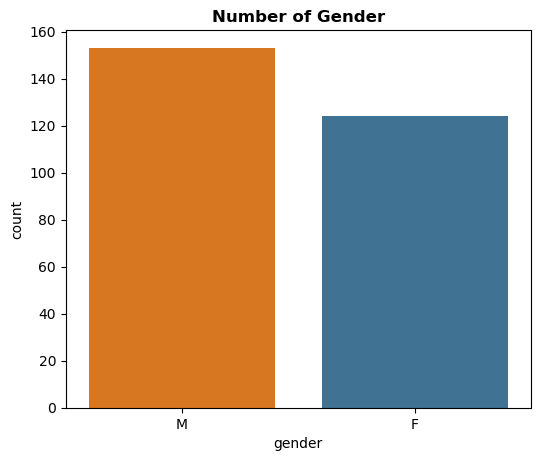
With the 'gender' feature, there are two values: 'F' and 'M'. In there, F means is female and M is Male. In this context, the number of users with a 'Male' gender is higher than those with a 'Female' gender
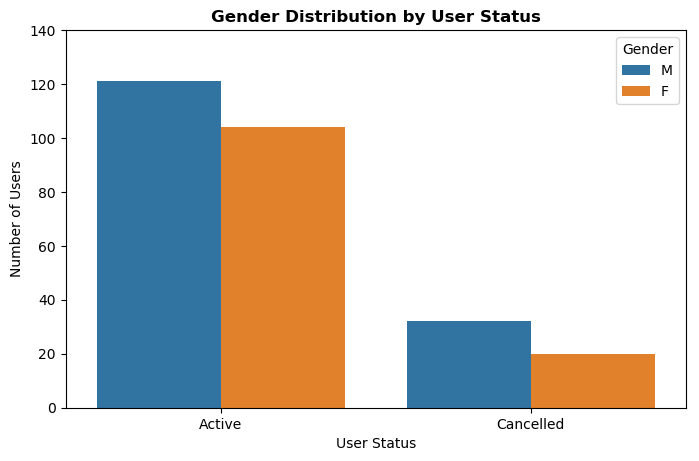
Below are some charts illustrating the correlation between gender and level with respect to the user status:
Results:
Process:
- Read data from DataFrame and select important features.
- Divide the data into training set, test set and validation set.
- Train the Logistic Regression model and evaluate performance using F1 Score.
- Train the Random Forest model and evaluate performance using F1 Score.
- Train the Logistic SVM model and evaluate performance using F1 Score.
- Train the GBoosting model and evaluate performance using F1 Score.
Comparison Table:
| Model | F1 Score | Time training (seconds) |
|---|---|---|
| Logistic Regression | 0.73 | 700 |
| Logistic SVM | 0.67 | 3590 |
| Random Forest | 0.71 | 348 |
| GBoosting | 0.69 | 1209 |
The best model to predict churn customer is Logistic Regression with F1 Score is 0.73 and time to train is 700 seconds. However, I see that Random Forest also is a strong model because time to train is faster and even score only smaller a little. Therefore, in the context of the Udacity Data Scientist Sparkify Capstone Project, Random Forest could be an alternative or supplementary model to consider alongside Gradient Boosting and Logistic Regression for predicting customer churn. Its ability to handle complex relationships in data and provide insights into feature importance makes it a valuable tool in the data scientist's toolkit.
Conclusion
Forecasting churn is a captivating yet challenging endeavor with the potential to enhance company operations. To gain deeper insights into the dataset, I delved into a Sparkify subset dataset, conducting a thorough analysis. Among various models, the Logistic Regression prediction model emerged as the most effective, boasting an impressive F1 score of 73%.
To elevate the model's predictive performance, an option is to train it using the complete dataset. And I need experimental many ML model like embedded model (LightGBM...), XGBoost...
Furthermore, recognizing that the existing features of the model lack influence on the churn rate, there arises a need to pinpoint and incorporate new features for refinement.
Improvements:
Limitations and Challenges: Despite the success of the Sparkify project, a few limitations and challenges emerged during its execution.
Imbalanced Dataset:
The Sparkify dataset exhibits a class imbalance, with a significantly higher number of non-churn instances compared to churn instances. This could lead to biased model predictions and impact the overall performance, especially in correctly identifying churn cases.
Feature Engineering Complexity:
The process of feature engineering, although essential for model training, can be complex and time-consuming. Exploring more advanced feature engineering techniques or automated methods could further enhance the model's ability to capture patterns in the data.
Model Interpretability:
While the selected model demonstrates strong predictive performance, its interpretability might be limited. Enhancements in model interpretability could provide more insights into the factors influencing churn prediction, aiding in better decision-making.
Areas for Improvement:
-
Addressing Class Imbalance: Implement advanced techniques for handling imbalanced datasets, such as oversampling the minority class, undersampling the majority class, or using synthetic data generation methods.
-
Automated Hyperparameter Tuning: Explore automated hyperparameter tuning techniques, such as Bayesian optimization or genetic algorithms, to efficiently search the hyperparameter space and potentially discover more optimal configurations.
-
Ensemble Methods: Experiment with ensemble methods to combine predictions from multiple models. This can often lead to improved generalization and robustness, especially when dealing with complex datasets.
-
Real-Time Prediction: Investigate the feasibility of deploying the model for real-time prediction, allowing Sparkify to identify potential churn events in a more timely manner and take proactive measures.
-
User Interaction Features: Incorporate additional features related to user interactions, such as session duration patterns, frequency of logins, or specific actions taken during a session. These could provide valuable insights into user behavior.
Acknowledgment:
I extend my sincere gratitude and acknowledgment to the following individuals, organizations, and resources that have played a crucial role in the success of the Sparkify project:
Mentors and Instructors: My heartfelt thanks to the mentors and instructors who provided guidance, support, and valuable insights throughout the duration of the project. Their expertise and feedback have been instrumental in shaping the project's success.
Udacity and Sparkify: I express my appreciation to Udacity for providing the platform and resources for this educational journey. Special thanks to Sparkify for making the dataset available, enabling me to apply my learning in a real-world context.
Peer Collaborators: A big thank you to fellow learners and collaborators who engaged in discussions, shared experiences, and provided constructive feedback. The collaborative environment significantly enriched the learning experience.
Open-Source Community: My gratitude to the open-source community for developing and maintaining the tools and libraries used in this project. The availability of such resources has been pivotal in the successful implementation of the Sparkify churn prediction solution.
Reference:
- https://spark.apache.org/docs/1.4.1/ml-features.html
- https://sparkbyexamples.com/machine-learning/confusion-matrix-in-machine-learning/
- https://spark.apache.org/docs/latest/ml-classification-regression.html#classification
- https://www.educative.io/answers/what-is-the-f1-score
- https://stackoverflow.com/questions/41032256/get-same-value-for-precision-recall-and-f-score-in-apache-spark-logistic-regres
- https://spark.apache.org/docs/latest/api/python/reference/api/pyspark.ml.tuning.CrossValidator.html
Thank you
My email: nguyennhan8521@gmail.com and my repo github for this project is My repo

All rights reserved
