Monitoring với Prometheus sử dụng Ansible
Bài đăng này đã không được cập nhật trong 7 năm

Vấn đề lớn nhất khi vận hành một dịch vụ IT theo bạn là gì ? Với tôi thì đó là khi khách hàng vào website và thông báo lại là dịch vụ không hoạt động, hay website "chết" rồi, trong khi trước đó mình lại hoàn toàn bị động không thể biết trước khách hàng.
Để phòng ngừa vấn đề này thì chúng ta cần setup một dịch vụ để monitoring như là một phần của hệ thống, có thể phát hiện được sớm nhất vấn để trước khi khách hàng biết.
Monitoring sẽ giúp chúng ta debug, phát hiện sớm vấn đề, cảnh báo nếu CPU hoặc memory vượt quá ngưỡng giới hạn. Hoặc một số các theo dõi khác về: tình trạng sử dụng CPU, memory, ổ cứng, network, .. monitoring giúp chúng ta giải quyết được triệt để vấn để, phân tích hiệu năng dựa trên các con số và biểu đồ.
Monitoring bao gồm collecting, processing, aggregating và hiển thị dữ liệu về hệ thống, cảnh báo dựa trên dữ liệu đã collect được.
Trong phạm vi bài viết này sẽ hướng dẫn các bạn cách thức thiết lập hệ thống monitoring sử dụng Prometheus và deploy bằng Ansible.
Ansible
Ansible là gì: Việc cài đặt và cấu hình các máy chủ thường được ghi chép lại trong tài liệu dưới dạng các câu lệnh đã chạy, với giải thích kèm theo. Ansible sinh ra là để làm tự động hóa việc đó.
Cụ thể về ansible và cách cài đặt/sử dụng, các bạn có thể tham khảo tại bài viết này: https://viblo.asia/p/phan-1-tim-hieu-ve-ansible-4dbZNxv85YM
Prometheus
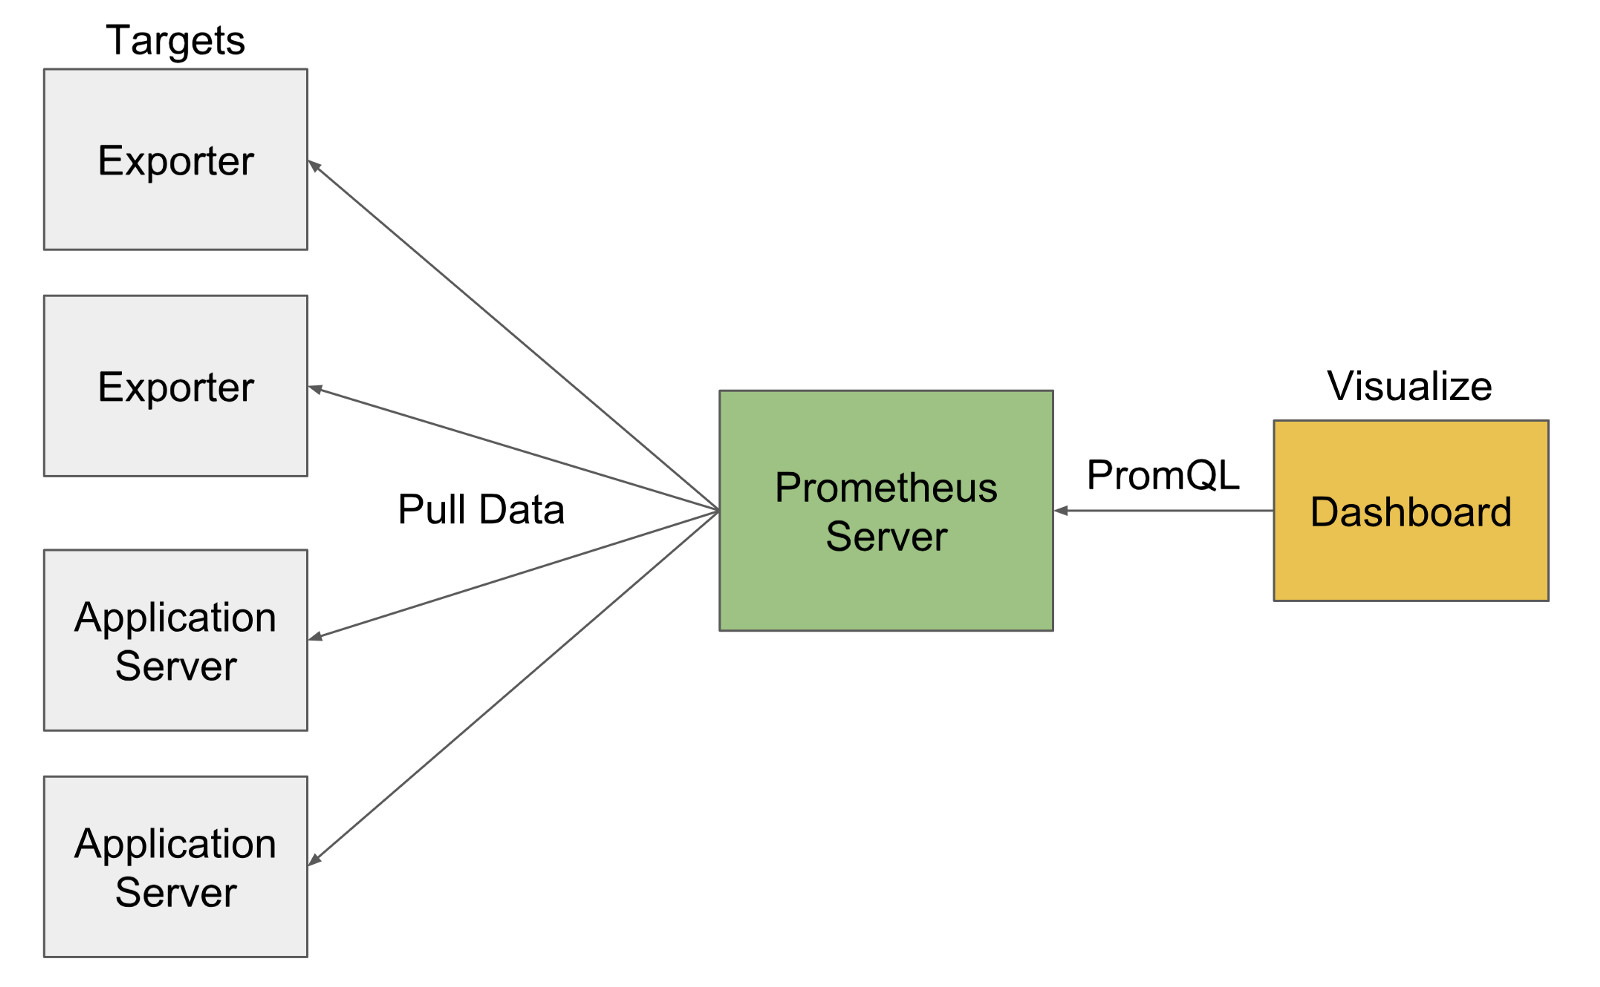
Prometheus là một tool sử dụng để monitoring dạng Open Source, mục đích giúp chúng ta scrape dữ liệu, query nó và tạo một dashboard sử dụng, phân tích dựa trên các alert rule mình đã tạo ra. Prometheus hỗ trợ cấu trúc Prom Query Language để tìm kiếm dữ liệu.
Prometheus có một component trung tâm để xử lý, gọi là master Server. Nó giúp chúng ta theo dõi các target servers thông qua việc: lấy dữ liệu từ các target server này như về CPU, sau đó lưu trữ vào 1 database dạng time-series. Chúng ta có thể sử dụng PromQL để query dữ liệu từ một hoặc nhiều target servers. Mặc định, Prometheus sẽ theo dõi chính nó (chính master server). Chúng ta có thể định nghĩa các rules/triggers và thông báo khi gặp vấn đề qua email, slack hoặc các alerting tool khác.
Bây giờ chúng ta sẽ bắt dầu setup Prometheus sử dụng Ansible.
Trước tiên cần tạo 1 user/group "prometheus", user này không thể đăng nhập vào instance mà chỉ có thể thao tác ở bên trong instance thôi. Các biến sử dụng sẽ được miêu tả bên dưới (để chung vào 1 file)
- name: Creating prometheus user group
  group: name="{{groupId}}"
  become: true
- name: Creating prometheus user
  user:
    name: "{{userId}}"
    group: "{{groupId}}"
    system: yes
    shell: "/sbin/nologin"
    comment: "{{userId}} nologin User"
    createhome: "no"
    state: present
Tiếp theo sẽ download và instance Prometheus với quyền của user "prometheus"
- name: Install prometheus
  unarchive:
    src: "https://github.com/prometheus/prometheus/releases/download/v{{ version }}/prometheus-{{ version }}.linux-amd64.tar.gz"
    dest: /tmp/
    remote_src: yes
- name: Copy prometheus file to bin
  copy:
    src: "/tmp/prometheus-{{ version }}.linux-amd64/prometheus"
    dest: "/usr/local/bin/prometheus"
    owner: "{{userId}}"
    group: "{{groupId}}"
    remote_src: yes
    mode: 0755
- name: Delete prometheus tmp folder
  file:
    path: '/tmp/prometheus-{{ version }}.linux-amd64'
    state: absent
Tiêp theo sẽ copy file cấu hình prometheus lên server.
- name: config file
  template:
    src: prometheus.conf.j2
    dest: /etc/prometheus/prometheus.conf
Như ở trên là đã seting xong Prometheus rồi, tuy nhiên cần làm 1 service trên OS để tự khởi động Prometheus khi hệ điều hành khởi động lại.
- name: Copy systemd init file
  template:
    src: init.service.j2
    dest: /etc/systemd/system/prometheus.service
  notify: systemd_reload
- name: Start prometheus service
  service:
    name: prometheus
    state: started
    enabled: yes
Bước tiếp theo là start server base trên file config. Vì thể trước tiên chúng ta cần kiểm tra hoạt động của HTTP, ví dụ như xem cổng 9090 có trả về 200 hay không?
- name: Check if prometheus is accessible
  uri:
    url: http://localhost:9090
    method: GET
    status_code: 200
Sau khi hoàn thành bước này rồi, thì chúng ta đã có 1 Prometheus server đang running và collecting dữ liệu từ chính nó.
Trường hợp chúng ta muốn collect thông tin như về infrastructure từ 1 instance khác thì cần phải setting node_exporter trên target server. Prometheus sẽ collect dữ liệu được trả về từ các node_exporter đó để phân tích và hiển thị báo cáo. Các thực hiện thực tế cũng tương tự như việc cài đặt Prometheus sử dụng Ansible
Trước tiên cần tạo 1 user/group có tên là "node_exporter"
- name: Creating node_exporter user group
  group: name="{{groupId}}"
  become: true
- name: Creating node_exporter user
  user:
    name: "{{userId}}"
    group: "{{groupId}}"
    system: yes
    shell: "/sbin/nologin"
    comment: "{{userId}} nologin User"
    createhome: "no"
    state: present
Tiếp theo là download và instance node_exporter và đưa vào thư mục "/usr/local/bin"
- name: Install prometheus node exporter
  unarchive:
    src: "https://github.com/prometheus/node_exporter/releases/download/v{{ version }}/node_exporter-{{ version }}.linux-amd64.tar.gz"
    dest: /tmp/
    remote_src: yes
- name: Copy prometheus node exporter file to bin
  copy:
    src: "/tmp/node_exporter-{{ version }}.linux-amd64/node_exporter"
    dest: "/usr/local/bin/node_exporter"
    owner: "{{userId}}"
    group: "{{groupId}}"
    remote_src: yes
    mode: 0755
- name: Delete node exporter tmp folder
  file:
    path: '/tmp/node_exporter-{{ version }}.linux-amd64'
    state: absent
Tạo dạng Service trên OS để tiện cho việc kiểm soát.
- name: Copy systemd init file
  template:
    src: init.service.j2
    dest: /etc/systemd/system/node_exporter.service
- name: Start node_exporter service
  service:
    name: node_exporter
    state: started
    enabled: yes
Sau khi đã setting xong, cần kiểm tra xem node_exporter đã hoạt động chưa bằng cách kiểm tra port :9100 và status trả về là 200.
- name: Check if node exporter emits metrics
  uri:
    url: http://127.0.0.1:9100/metrics
    method: GET
    status_code: 200
Khi đã có node_exporter chạy rồi, thì nên cài thêm blackbox_exporter để monitor các dịch vụ khác ví dụ như HTTP. Thực hiện cài đặt cũng tương tự như cài node_exporter như sau:
Tạo user/group để chạy blackbox_exporter.
- name: Creating blackbox_exporter user group
  group: name="{{groupId}}"
  become: true
- name: Creating blackbox_exporter user
  user:
    name: "{{userId}}"
    group: "{{groupId}}"
    system: yes
    shell: "/sbin/nologin"
    comment: "{{userId}} nologin User"
    createhome: "no"
    state: present
Tiếp theo download blackbox_exporter và đặt vào thư mục "/usr/local/bin"
- name: Copy prometheus blackbox exporter file to bin
  copy:
    src: "/tmp/blackbox_exporter-{{ version }}.linux-amd64/blackbox_exporter"
    dest: "/usr/local/bin/blackbox_exporter"
    owner: "{{userId}}"
    group: "{{groupId}}"
    remote_src: yes
    mode: 0755
- name: Delete blackbox exporter tmp folder
  file:
    path: '/tmp/blackbox_exporter-{{ version }}.linux-amd64'
    state: absent
Tạo service start/stop blackbox
- name: Copy blackbox exporter config file
  template:
    src: blackbox.yml.j2
    dest: /data/blackbox_exporter/blackbox.yml
    owner: "{{userId}}"
    group: "{{groupId}}"
- name: Copy systemd init file
  template:
    src: init.service.j2
    dest: /etc/systemd/system/blackbox_exporter.service
  notify: systemd_reload
- name: Start blackbox_exporter service
  service:
    name: blackbox_exporter
    state: started
    enabled: yes
Kiểm tra blackbox_exporter đã hoạt động chưa
- name: Check if blackbox_exporter is accessible
  uri:
    url: http://localhost:9115
    method: GET
    status_code: 200
Dưới đây là các file template cấu hình: Ở trong file "backbox.yml" sẽ định nghĩa việc sử dụng HTTP module để test
backbox.yml
modules:
  http_2xx:
    prober: http
    timeout: 5s
    http:
      preferred_ip_protocol: "ipv4"
      valid_http_versions: ["HTTP/1.1", "HTTP/2"]
      valid_status_codes: []
      method: GET
prometheus.conf
global:
  scrape_interval: 15s
scrape_configs:
  - job_name: 'prometheus'
    scrape_interval: 5s
    static_configs:
      - targets: ['localhost:9090']
  - job_name: 'node_exporter'
    scrape_interval: 5s
    static_configs:
      - targets:
      {% for host in groups['all'] %}
      {% if inventory_hostname != host %}
        - '{{ host }}:9100'
      {% endif %}
      {% endfor %}
  - job_name: 'blackbox'
    metrics_path: /probe
    params:
      module: [http_2xx]
    static_configs:
      - targets:
        - http://www.google.com
    relabel_configs:
      - source_labels: [__address__]
        target_label: __param_target
      - source_labels: [__param_target]
        target_label: instance
      - target_label: __address__
        replacement: localhost:9115
Tiếp theo là vào dashboard của Prometheus để kiểm tra các thông số và verify sự hoạt động.

Toàn bộ targets đã được monitor sử dụng Prometheus

Truy vẫn trạng thái của toàn bộ targets sử dụng node_exporter

Sử dụng blacbox_exporter
Toàn bộ source code có thể tham khảo tại đây: https://github.com/MiteshSharma/PrometheusWithAnsible
**Tham khảo: **
All rights reserved
