


Lab 8.3 - Thiết lập Alerting - Cấu hình Prometheus để load Alert Rule bằng Helm
Ở phần trước, chúng ta đã tạo các Alert Rule bằng PromQL để Prometheus có thể phát hiện các vấn đề như:
- API Todo không hoạt động.
- Pod restart liên tục.
- Memory sử dụng quá cao.
- HTTP 5xx tăng bất thường.
- Request latency tăng cao.
Tuy nhiên, hiện tại các Rule này mới chỉ tồn tại dưới dạng file YAML trên máy local.
Prometheus trong Kubernetes chưa biết đến chúng.
Trong phần này, chúng ta sẽ cấu hình để Prometheus tự động load các Alert Rule thông qua Helm.
1. Prometheus quản lý Alert Rule như thế nào?
Prometheus sử dụng file cấu hình:
prometheus.yml
Trong file này có một phần quan trọng:
rule_files:
  - /etc/config/alert-rules/*.yaml
rule_files khai báo nơi Prometheus tìm kiếm các Alert Rule.
Khi Prometheus khởi động, nó sẽ:
- Đọc file
prometheus.yml. - Tìm các file được khai báo trong
rule_files. - Load các Alert Rule.
- Bắt đầu đánh giá các biểu thức PromQL theo chu kỳ.
Luồng hoạt động:
alert-rules.yaml
        ↓
Prometheus Config
        ↓
Prometheus Rule Engine
        ↓
Evaluate PromQL
        ↓
   Alertmanager
2. Kiểm tra Helm Chart đang sử dụng
Trong Lab trước, chúng ta đã triển khai:
helm list -n monitoring
Kết quả:
NAME            NAMESPACE       REVISION        UPDATED                                 STATUS          CHART                   APP VERSION
grafana         monitoring      1               2026-07-31 16:47:46.440706 +0900 JST    deployed        grafana-10.5.15         12.3.1
prometheus      monitoring      3               2026-08-04 11:04:27.261884 +0900 JST    deployed        prometheus-29.20.1      v3.13.2
Kiểm tra Chart:
helm repo list
Kết quả:
NAME                    URL
prometheus-community    https://prometheus-community.github.io/helm-charts
grafana                 https://grafana.github.io/helm-charts
Thực tế việc tách riêng file chứa toàn bộ Alert Rule là hoàn toàn hợp lý trong môi trường production. Nhưng với chart prometheus-community/prometheus hiện tại, việc này phức tạp hơn khá nhiều so với lợi ích nhận được. Vì vậy ở lab này tôi sẽ gộp phần Alert Rule luôn vào file prometheus-values.yaml. Để đơn giản và tiếp tục các phần tiếp. Còn về cách tách riêng file sẽ được viết trong 1 lab khác với chart prometheus-community/kube-prometheus-stack
3. Thêm Alert Rule vào Prometheus
Bước 1. Kiểm tra file Alert Rule
alert-rules.ymlđã được tạo ở lab trước
Bước 2. Kiểm tra Prometheus values hiện tại
Trước khi chỉnh sửa, kiểm tra cấu hình hiện tại:
helm get values prometheus -n monitoring
Hiện tại bạn đang có:
USER-SUPPLIED VALUES:
extraScrapeConfigs: |
  - job_name: todo-api

    metrics_path: /actuator/prometheus

    static_configs:
      - targets:
          - todo-backend-service.todo-app.svc.cluster.local:8080
Đây là cấu hình của Lab 7 để Prometheus scrape Spring Boot Actuator.
Chúng ta cần giữ nguyên cấu hình này.
Bước 3. Cập nhật file prometheus-values.yaml
Mở:
prometheus-values.yaml
Hiện tại:
extraScrapeConfigs: |
  - job_name: todo-api

    metrics_path: /actuator/prometheus

    static_configs:
      - targets:
          - todo-backend-service.todo-app.svc.cluster.local:8080
Thêm phần:
serverFiles:
  alerts:
    todo-alerts.yml:
    # Dán nội dung file alert-rules.yml vào đây
Sau đó ta sẽ có file prometheus-values.yaml hoàn chỉnh, chứa cấu hình của scrape và alerts.
Bước 4. Upgrade Helm
Sau khi chỉnh sửa:
helm upgrade prometheus \
prometheus-community/prometheus \
-f monitoring/prometheus-values.yaml \
-n monitoring
Kết quả:
Release "prometheus" has been upgraded. Happy Helming!
NAME: prometheus
LAST DEPLOYED: Fri Aug  7 12:48:42 2026
NAMESPACE: monitoring
STATUS: deployed
REVISION: 4
DESCRIPTION: Upgrade complete
TEST SUITE: None
NOTES:
The Prometheus server can be accessed via port 80 on the following DNS name from within your cluster:
prometheus-server.monitoring.svc.cluster.local
Bước 5. Kiểm tra Alert Rule đã vào Prometheus
Kiểm tra ConfigMap:
kubectl get configmap -n monitoring
Bạn sẽ thấy:
NAME                      DATA   AGE
...
prometheus-server         7      6d23h
Kiểm tra:
kubectl get configmap prometheus-server \
-n monitoring \
-o yaml | grep todo-alerts
Nếu thấy:
- name: todo-alerts
là thành công.
Bước 6. Kiểm tra Alert Rule trong Prometheus UI
Port-forward:
kubectl port-forward \
svc/prometheus-server \
9090:80 \
-n monitoring
Truy cập:
http://localhost:9090
Vào:
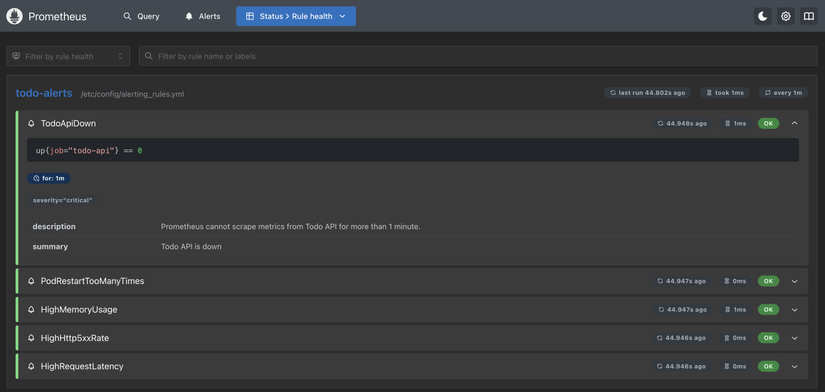
Status -> Rule health hoặc Alert
Bạn sẽ thấy:
Bước 7. Kiểm tra bằng PromQL
Trong Prometheus, chạy:
up{job="todo-api"}
Kết quả:
1
Có nghĩa:
    Prometheus
         ↓
todo-backend-service
         ↓
/actuator/prometheus

OK
Bước 8. Test Alert Rule
Để thử Alert, tạm thời làm cho Backend không scrape được.
Ví dụ scale Deployment về 0:
kubectl scale deployment todo-backend \
--replicas=0 \
-n todo-app
Sau khoảng 1 phút:
Prometheus:
Alerts
sẽ thấy:
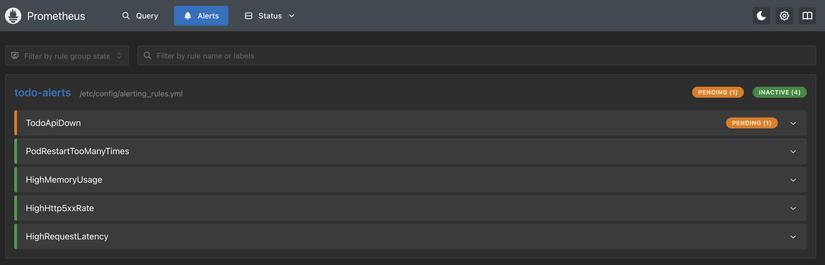
TodoApiDown → PENDING
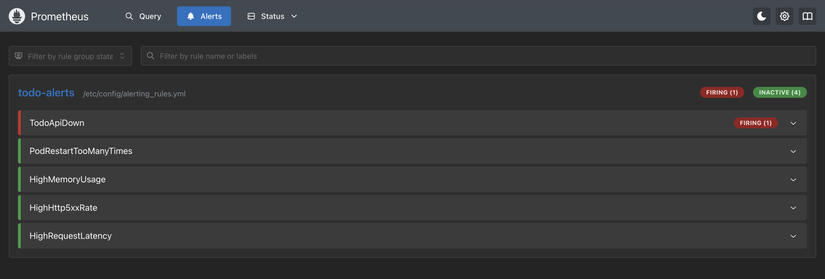
Sau khi đủ: for: 1m sẽ chuyển: Firing
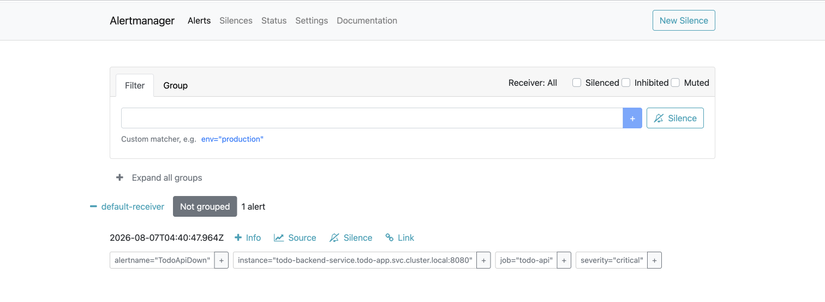
Sau đó Alert sẽ được gửi sang Alertmanager:
Tổng kết
Sau phần này:
- ✅ Hiểu cách Prometheus load Alert Rules
- ✅ Quản lý Alert Rule bằng Helm
- ✅ Không chỉnh sửa trực tiếp file trong Pod
- ✅ Tạo Alert đầu tiên cho Todo API
- ✅ Kiểm tra Alert trong Prometheus UI
- ✅ Sẵn sàng kết nối Alertmanager
Trong Lab sau, chúng ta sẽ cấu hình Alertmanager Receiver:
- Email notification.
- Slack notification.
- Routing Alert theo severity.
- Group Alert.
- Kiểm thử gửi thông báo thực tế.
All rights reserved