Giới thiệu thư viện Highcharts
Bài đăng này đã không được cập nhật trong 4 năm
1.Giới thiệu
Highchart là một thư viện Java Script dùng để hỗ trợ lập trình viên trong việc tạo ra các biểu đồ đẹp mắt với các Setting rất phong phú về màu sắc,dạng biểu đồ,...Highcharts có thể đáp ứng được hầu như tất cả các yêu cầu về vẽ biểu đồ trong các ứng dụng web.Do Highchart được tạo bởi javascript nên có thể tích hợp dễ dàng vào các website và tương tác tốt với nhiều ngôn ngữ lập trình.
2.Cách tạo một biểu đồ với Highchart
2.1.Tạo một rails project
Trong màn hình console gõ lệnh
rails new highchart_demo
Sau đó tạo một trang static page
2.2.Import thư viện highchart
Cách 1:Thêm đường dẫn thư viện vào trong thẻ head
<script src="https://code.highcharts.com/highcharts.js"></script>
<script src="https://code.highcharts.com/modules/exporting.js"></script>
Cách 2:Vào trang https://code.highcharts.com/highcharts.js coppy toàn bộ code cho vào một file highchart_lib.js sau đó link tới file js đó.
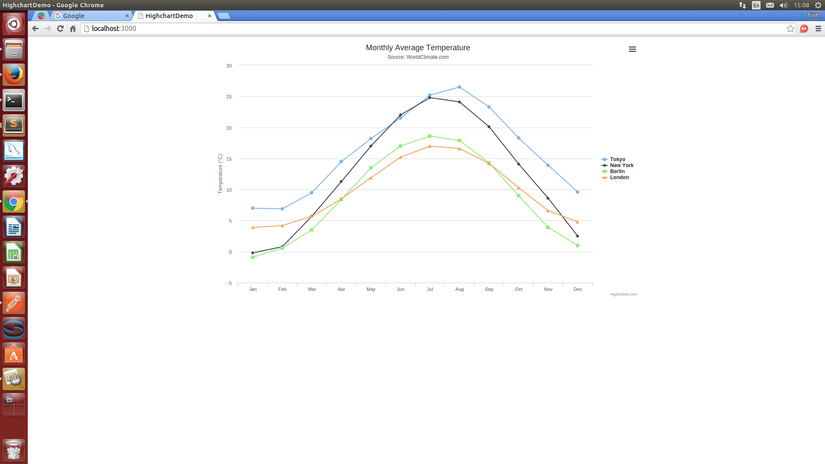
2.3.Ví dụ tạo biểu đồ nhiệt độ của một số thành phố
Trong home.html.erb tạo một thẻ div
<div id="container" style="width: 1000px; height: 600px; margin: 0 auto"></div>
Tạo 1 file assets/javascripts/highcharts.js
$(function () {
    $('#container').highcharts({
        title: {
            text: 'Monthly Average Temperature',
            x: -20 //center
        },
        subtitle: {
            text: 'Source: WorldClimate.com',
            x: -20
        },
        xAxis: {
            categories: ['Jan', 'Feb', 'Mar', 'Apr', 'May', 'Jun',
                'Jul', 'Aug', 'Sep', 'Oct', 'Nov', 'Dec']
        },
        yAxis: {
            title: {
                text: 'Temperature (°C)'
            },
            plotLines: [{
                value: 0,
                width: 1,
                color: '#808080'
            }]
        },
        tooltip: {
            valueSuffix: '°C'
        },
        legend: {
            layout: 'vertical',
            align: 'right',
            verticalAlign: 'middle',
            borderWidth: 0
        },
        series: [{
            name: 'Tokyo',
            data: [7.0, 6.9, 9.5, 14.5, 18.2, 21.5, 25.2, 26.5, 23.3, 18.3, 13.9, 9.6]
        }, {
            name: 'New York',
            data: [-0.2, 0.8, 5.7, 11.3, 17.0, 22.0, 24.8, 24.1, 20.1, 14.1, 8.6, 2.5]
        }, {
            name: 'Berlin',
            data: [-0.9, 0.6, 3.5, 8.4, 13.5, 17.0, 18.6, 17.9, 14.3, 9.0, 3.9, 1.0]
        }, {
            name: 'London',
            data: [3.9, 4.2, 5.7, 8.5, 11.9, 15.2, 17.0, 16.6, 14.2, 10.3, 6.6, 4.8]
        }]
    });
});
Chạy màn hình view ta thu được biểu đồ có dạng như sau:
3.Các Setting trong Highchart
3.1.Setting chart type
Để setting chart type bạn viết.
chart: {
        type: "areaspline",
      },
- Các từ khóa chart type được hỗ trợ bởi highchart:area, arearange, areaspline, areasplinerange, bar, boxplot, bubble, column, columnrange, errorbar, funnel, gauge, heatmap, line, pie, polygon, pyramid, scatter, series, solidgauge, spline, treemap, waterfall.
Nếu bạn không khai báo gì thì chart type mặc định là "line" Từ những chart type như trên highchart đã tạo ra rất nhiều dạng biểu đồ được liệt kê trong bảng dưới đây.
| Dạng biểu đồ | Tên |
|---|---|
| LINE CHART | basic line |
| clickable points | |
| with data labels | |
| time series + zoomable | |
| spline with inverted axes | |
| spline with symbols | |
| spline with symbols | |
| spline with plot bands | |
| logarithmic axis | |
| AREA CHARTS | basic area |
| area with negative values, | |
| stack area. | |
| percentage area | |
| area with missing points | |
| inverted axes | |
| area-spline | |
| area range | |
| area range and line | |
| sparkline charts | |
| COLUMN AND BAR CHARTS | basic bar |
| stscked bar | |
| bar with negative values | |
| stacked column | |
| stacked and grouped column | |
| stack percentage column | |
| column with rotated labels | |
| column with drilldown | |
| fixed placement columns | |
| data defined in a HTML table | |
| column range | |
| PIE CHARTS | pie chart |
| pie with legend | |
| donut chart | |
| semi circle dount | |
| pie with drilldown | |
| pie with gradient fill | |
| pie with monochrome fill | |
| SCATTER AND BUBBLE CHARTS | |
| scatter plot | |
| bubble chart | |
| 3D bubbles. | |
| DYNAMIC CHARTS | |
| spline updating each second | |
| click to add a point, | |
| master-detail chart. | |
| COMBINATIONS | column + line and pie |
| dual axes | |
| line and column, | |
| multiple axes, | |
| scatter with regression line, | |
| meteogram. | |
| 3D CHARTS | 3D column, |
| 3D column with null and 0 values, | |
| 3d column with stacking and grouping, | |
| 3D pie | |
| 3D donut | |
| 3D scatter chart | |
| GAUGES | angular gauge |
| solid gauge | |
| clock | |
| gauge with dual axes | |
| VU metter | |
| HEAT MAPS | heat map |
| large heat map | |
| MORE CHART TYPES | polar chart |
| spiderweb | |
| wind rose | |
| box plot | |
| error bar | |
| waterfall | |
| funnel chart | |
| pyramid chart | |
| general drawing |
Tất cả các dạng biểu đồ đều có bản demo ở đây: http://www.highcharts.com/demo/
3.2.Các setting chính và cấu trúc viết
- Highchart có 19 setting chính với vô số những setting nhỏ bên trong giúp cho lập trình viên có thể tinh chỉnh được đồ thị của mình theo ý muốn.Các thẻ được viết trong hàm $("#container").highcharts() như bên dưới đây:
$("#container").highcharts({
    chart: {…}
    colors: […]
    credits: {…}
    data: {…}
    drilldown: {…}
    exporting: {…}
    labels: {…}
    legend: {…}
    loading: {…}
    navigation: {…}
    noData: {…}
    pane: {…}
    plotOptions: {…}
    series: [{…}]
    subtitle: {…}
    title: {…}
    tooltip: {…}
    xAxis: {…}
    yAxis: {…}
});
1. "chart" Setting
    chart: {
        alignTicks: true
        animation: true
        backgroundColor: "#FFFFFF"
        borderColor: "#4572A7"
        borderRadius: 0
        borderWidth: 0
        className: undefined
        defaultSeriesType: "line"
        events: {…}
        height: undefined
        ignoreHiddenSeries: true
        inverted: false
        margin: undefined
        marginBottom: undefined
        marginLeft: undefined
        marginRight: undefined
        marginTop: undefined
        options3d: {…}
        panKey:
        panning: false
        pinchType: null
        plotBackgroundColor: undefined
        plotBackgroundImage: undefined
        plotBorderColor: "#C0C0C0"
        plotBorderWidth: 0
        plotShadow: false
        polar: false
        reflow: true
        renderTo: undefined
        resetZoomButton: {…}
        selectionMarkerFill: "rgba(69,114,167,0.25)"
        shadow: false
        showAxes: false
        spacing: [10, 10, 15, 10]
        spacingBottom: 15
        spacingLeft: 10
        spacingRight: 10
        spacingTop: 10
        style: {"fontFamily":"\"Lucida Grande\", \"Lucida Sans Unicode\", Verdana, Arial, Helvetica, sans-serif","fontSize":"12px"}
        type: "line"
        width: undefined
        zoomType: undefined
        }
2. "colors" Setting
Màu nền:được viết trong thẻ chart:
    chart: {
               backgroundColor: '#FCFFC5',
            },
Màu cho chart có nhiều phần tử:
    Highcharts.setOptions({
            colors: ['#058DC7', '#50B432', '#ED561B', '#DDDF00', '#24CBE5', '#64E572', '#FF9655', '#FFF263', '#6AF9C4']
        });
Màu cho từng phần tử dữ liệu. ví dụ màu của đường vẽ trong line chart:
    series: [{
        data: [
            color: '#00FF00'
        ]
    }]
3. "credits" Setting
    credits: {
            enabled: true
            href: "http://www.highcharts.com"
            position: undefined
            style: undefined
            text:} // Highchart theo mặc định đặt một nhãn tín ở góc dưới bên phải của biểu đồ.Bạn có thể thay đổi bằng cách sử dụng các tùy chọn credits.
4. "data" Setting
    data: {
            columns:
            complete:
            csv:
            dateFormat: undefined
            decimalPoint: "."
            endColumn:
            endRow:
            firstRowAsNames: true
            googleSpreadsheetKey:
            googleSpreadsheetWorksheet: undefined
            itemDelimiter:
            lineDelimiter: "\n"
            parseDate:
            parsed:
            rows:
            seriesMapping: undefined
            startColumn: 0
            startRow: 0
            switchRowsAndColumns: false
            table:
        }
5. "drilldown" Setting
    drilldown
        : {
        activeAxisLabelStyle: undefined
        activeDataLabelStyle: undefined
        allowPointDrilldown: true
        animation: undefined
        drillUpButton: {…}
        series: undefined
    }
6. "exporting" Setting
    exporting:  {
            allowHTML: false
            buttons: {
                contextButton: {…}
            }
            chartOptions: null
            enabled: true
            fallbackToExportServer: true
            filename: "chart"
            formAttributes:
            scale: 2
            sourceHeight:
            sourceWidth:
            type: "image/png"
            url: "http://export.highcharts.com"
            width: undefined
        } //  cho phép người dùng tải biểu đồ về dưới dạng PDF, PNG, JPG hoặc SVG.
7. "labels" Setting
    labels: {
            items: [{
            html: undefined
            style: undefined
            }]
            style: undefined
        }
8. "legend" Setting
    legend: {
            align: "center"
            backgroundColor: undefined
            borderColor: "#909090"
            borderRadius: 0
            borderWidth: 0
            enabled: true
            floating: false
            itemDistance: 20
            itemHiddenStyle: undefined
            itemHoverStyle: undefined
            itemMarginBottom: 0
            itemMarginTop: 0
            itemStyle: { "color": "#333333", "cursor": "pointer", "fontSize": "12px", "fontWeight": "bold" }
            itemWidth: undefined
            labelFormat: "{name}"
            labelFormatter: undefined
            layout: "horizontal"
            lineHeight: 16
            margin: 12
            maxHeight: undefined
            navigation: {
            activeColor: "#3E576F"
            animation: true
            arrowSize: 12
            inactiveColor: "#CCC"
            style: undefined
            }
            padding: 8
            reversed: false
            rtl: false
            shadow: false
            style: undefined
            symbolHeight: undefined
            symbolPadding: 5
            symbolRadius: 0
            symbolWidth: 16
            title: {
            style: {"fontWeight":"bold"}
            text: null
            }
            useHTML: false
            verticalAlign: "bottom"
            width: undefined
            x: 0
            y: 0
        }  // legend là một hộp có chứa một biểu tượng và tên cho mỗi mục series hoặc mục điểm trong biểu đồ.
9. "loading" Setting
    loading: {
            hideDuration: 100
            labelStyle: { "fontWeight": "bold", "position": "relative", "top": "45%" }
            showDuration: 100
            style: undefined
        } //  kiểm soát sự xuất hiện của màn hình tải bao gồm các khu vực âm mưu về hoạt động biểu đồ. Màn hình này chỉ xuất hiện sau khi một cuộc gọi rõ ràng để chart.showLoading(). Nó là một tiện ích cho các nhà phát triển để giao tiếp với người dùng cuối một cái gì đó đang xảy ra, ví dụ trong khi lấy dữ liệu mới thông qua một kết nối XHR. Các "Loading ..." văn bản tự nó không phải là một phần của đối tượng cấu hình này, nhưng một phần của đối tượng lang.
10. "navigation" Setting
    navigation: {
            buttonOptions: {
            align: "right"
            enabled: true
            height: 20
            symbolFill: "#E0E0E0"
            symbolSize: 14
            symbolStroke: "#666"
            symbolStrokeWidth: 1
            symbolX: 12.5
            symbolY: 10.5
            text: null
            theme:
            verticalAlign: "top"
            width: 24
            y: 0
            }
            menuItemHoverStyle: undefined
            menuItemStyle: undefined
            menuStyle: undefined
       }
11. "noData" Setting
    noData: {
            attr: undefined
            position: { "x": 0, "y": 0, "align": "center", "verticalAlign": "middle" }
            style: { "fontSize": "12px", "fontWeight": "bold", "color": "#60606a" }
            useHTML: false
            }
12. "pane" Setting
     pane: {
            background: undefined
            center: ["50%", "50%"]
            endAngle: undefined
            size: 85%
            startAngle: undefined
        }
13. "plotOptions" Setting
    plotOptions: {
            area: {…}
            arearange: {…}
            areaspline: {…}
            areasplinerange: {…}
            bar: {…}
            boxplot: {…}
            bubble: {…}
            column: {…}
            columnrange: {…}
            errorbar: {…}
            funnel: {…}
            gauge: {…}
            heatmap: {…}
            line: {…}
            pie: {…}
            polygon: {…}
            pyramid: {…}
            scatter: {…}
            series: {…}
            solidgauge: {…}
            spline: {…}
            treemap: {…}
            waterfall: {…}
        } // Setting The plotOptions is a wrapper object for config objects for each series type. The config objects for each series can also be overridden for each series item as given in the series array.
14. "series" Setting
series: [{…}] // Chứa các setting về dữ liệu của biểu đồ vì thế rất quan trọng và được sử dụng phổ biến trong highchart.
15. "subtitle" Setting
    subtitle: {
        align: "center"
        floating: false
        style: { "color": "#555555" }
        text: undefined
        useHTML: false
        verticalAlign: " "
        x: 0
        y: null
    }
16. "title" Setting
    title: {
            align: "center"
            floating: false
            margin: 15
            style: { "color": "#333333", "fontSize": "18px" }
            text: "Chart title"
            useHTML: false
            verticalAlign: " "
            x: 0
            y: undefined
            }
17. "tooltip" Setting
    tooltip: {
            animation: true
            backgroundColor: "rgba(255, 255, 255, 0.85)"
            borderColor: null
            borderRadius: 3
            borderWidth: 1
            crosshairs: undefined
            dateTimeLabelFormats:
            enabled: true
            followPointer: false
            followTouchMove: true
            footerFormat: "false"
            formatter: undefined
            headerFormat:
            hideDelay: 500
            pointFormat: "<span style="color:{point.color}">\u25CF</span> {series.name}: <b>{point.y}</b><br/>"
            pointFormatter:
            positioner: undefined
            shadow: true
            shape: "callout"
            shared: false
            snap: undefined
            style: { "color": "#333333", "cursor": "default", "fontSize": "12px", "padding": "8px", "pointerEvents": "none", "whiteSpace": "nowrap" }
            useHTML: false
            valueDecimals: undefined
            valuePrefix: undefined
            valueSuffix: undefined
            xDateFormat: undefined
            }
18. "xAxis" Setting
    xAxis: {
            allowDecimals: true
            alternateGridColor: undefined
            breaks: [{…}]
            categories: undefined
            ceiling:
            crosshair: {…}
            dateTimeLabelFormats: undefined
            endOnTick: false
            events: {…}
            floor: null
            gridLineColor: "#D8D8D8"
            gridLineDashStyle: "Solid"
            gridLineWidth: 0
            gridZIndex: 1
            id: undefined
            labels: {…}
            lineColor: "#C0D0E0"
            lineWidth: 1
            linkedTo: undefined
            max: undefined
            maxPadding: 0.01
            maxZoom: undefined
            min: undefined
            minPadding: 0.01
            minRange: undefined
            minTickInterval: undefined
            minorGridLineColor: "#E0E0E0"
            minorGridLineDashStyle: "Solid"
            minorGridLineWidth: 1
            minorTickColor: "#A0A0A0"
            minorTickInterval: undefined
            minorTickLength: 2
            minorTickPosition: "outside"
            minorTickWidth: 0
            offset: 0
            opposite: false
            plotBands: [{…}]
            plotLines: [{…}]
            reversed: false
            showEmpty: true
            showFirstLabel: true
            showLastLabel: true
            startOfWeek: 1
            startOnTick: false
            tickAmount: undefined
            tickColor: "#C0D0E0"
            tickInterval: undefined
            tickLength: 10
            tickPixelInterval: undefined
            tickPosition: "outside"
            tickPositioner: undefined
            tickPositions: undefined
            tickWidth: 1
            tickmarkPlacement: null
            title: {…}
            type: "linear"
            units:
            visible: true} // trục hoành và trục tung đều cung cấp các setting trên.
19. "yAxis" Setting
yAxis: {…} // Cung cấp đầy đủ các setting giống như xAxis Setting
3.4.Các Set Options trong Highchart
Highcharts.setOptions({
    global: {
        Date: undefined
        VMLRadialGradientURL: "http://code.highcharts.com/{version}/gfx/vml-radial-gradient.png"
        canvasToolsURL: "http://code.highcharts.com/{version}/modules/canvas-tools.js"
        getTimezoneOffset:
        timezoneOffset: 0
        useUTC: true
    }
    lang: {
        contextButtonTitle: "Chart context menu"
        decimalPoint: "."
        downloadJPEG: "Download JPEG image"
        downloadPDF: "Download PDF document"
        downloadPNG: "Download PNG image"
        downloadSVG: "Download SVG vector image"
        drillUpText: "Back to {series.name}"
        invalidDate:
        loading: "Loading..."
        months: [ "January" , "February" , "March" , "April" , "May" , "June" , "July" , "August" , "September" , "October" , "November" , "December"]
        noData: "No data to display"
        numericSymbols: [ "k" , "M" , "G" , "T" , "P" , "E"]
        printChart: "Print chart"
        resetZoom: "Reset zoom"
        resetZoomTitle: "Reset zoom level 1:1"
        shortMonths: [ "Jan" , "Feb" , "Mar" , "Apr" , "May" , "Jun" , "Jul" , "Aug" , "Sep" , "Oct" , "Nov" , "Dec"]
        thousandsSep: " "
        weekdays: ["Sunday", "Monday", "Tuesday", "Wednesday", "Thursday", "Friday", "Saturday"]
    }
});
4.Kết Luận
Như vậy là tôi đã giới thiệu xong tới các bạn về thư viện hữu ích highchart.Cảm ơn bạn đã đọc bài viết này.
5.Tài liệu tham khảo
Mọi Settings đầy đủ của thư viện highcharts được cung cấp đầy đủ trên trang tài liệu:
http://api.highcharts.com/highcharts
Các biều đồ demo được cung cấp phong phú trên trang.
All rights reserved
