Giới thiệu Principal Component Analysis
Bài đăng này đã không được cập nhật trong 3 năm
Mở đầu.
Principal Component Analysis (PCA) is a technique for reducing the dimensionality of a dataset while retaining most of its important features. It is widely used in data analysis and machine learning, and is particularly useful for visualizing high-dimensional data.
What is PCA
PCA is a mathematical technique that transforms a set of high-dimensional data points into a set of lower-dimensional points, while retaining most of the important information in the original data. The lower-dimensional points are called principal components, and are a linear combination of the original data points.
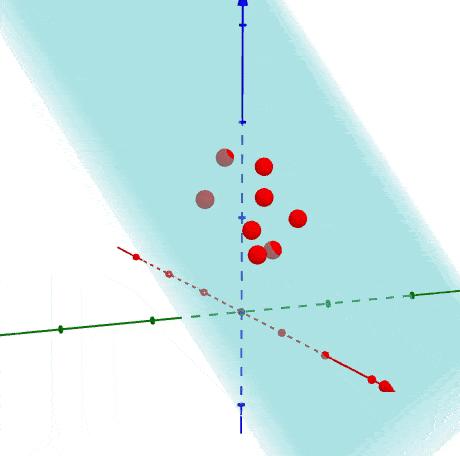
The goal of PCA is to find the directions in the original data that capture the most variation in the data. These directions are called principal axes, and the corresponding principal components are the projections of the data onto these axes
How does PCA work
PCA works by finding the eigenvectors and eigenvalues of the covariance matrix of the original data. The eigenvectors are the principal axes, and the eigenvalues indicate the amount of variation in the data that is captured by each principal component.
The PCA algorithm can be broken down into the following steps:
-
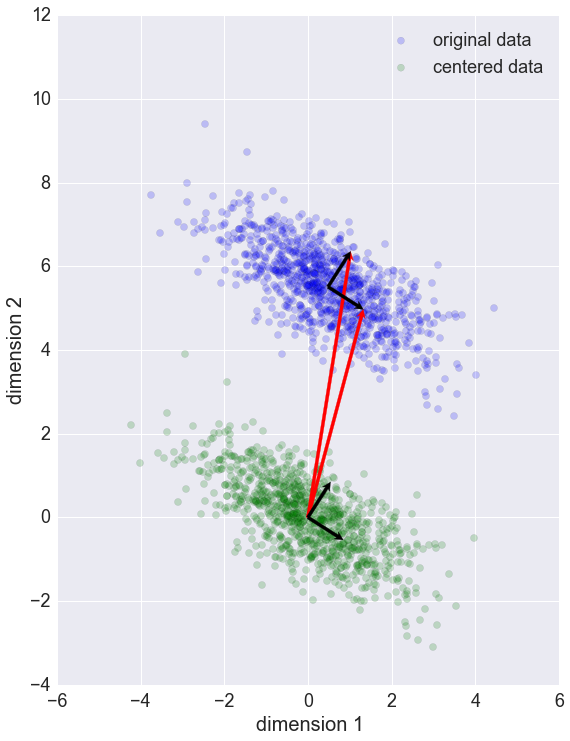
Standardize the data: PCA assumes that the data is centered around the origin, so we need to standardize the data by subtracting the mean from each data point and dividing by the standard deviation.
-
Compute the covariance matrix: We compute the covariance matrix of the standardized data.
-
Compute the eigenvectors and eigenvalues of the covariance matrix: We use a linear algebra library to compute the eigenvectors and eigenvalues of the covariance matrix.
-
Select the principal components: We select the k principal components with the highest eigenvalues, where k is the desired dimensionality of the lower-dimensional data.
-
Transform the data: We project the original data onto the k principal components to obtain the lower-dimensional data.
Dữ liệu.
Chúng ta cần phân biệt 2 loại dữ liệu:
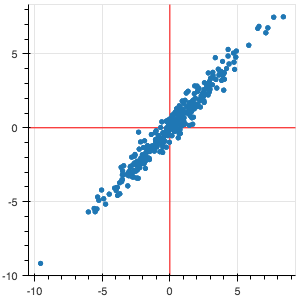
- Dữ liệu liên quan (correlated):
- Dữ liệu không liên quan (uncorrelated):

PCA tìm ra mean và principal components.

Làm thế nào để implement PCA:
- Biến đổi X về dạng đồng nhất.
- Tính toán covariance matrix Σ
- Tìm eigenvectors của Σ
- Lấy K dimensions có giá trị variance cao nhất
eigenvectors (vector màu đỏ)
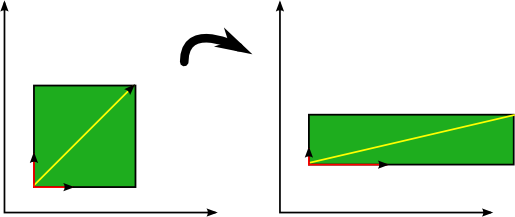
là vector không thay đổi hướng khi apply linear transformation.
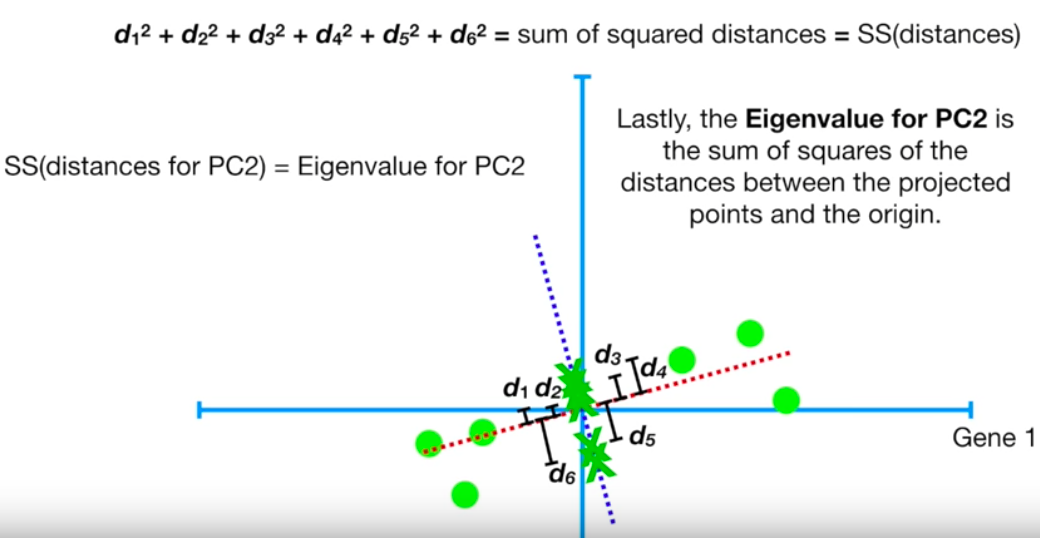
eigenvalue cho PC1

eigenvalue cho PC2
eigenvector

Sự phân bổ độ quan trọng của chiều dữ liệu


Algorithm
from numpy import array
from numpy import mean
from numpy import cov
from numpy.linalg import eig
# define a matrix
A = array([[1, 2], [3, 4], [5, 6]])
print(A)
# calculate the mean of each column
M = mean(A.T, axis=1)
print(M)
# center columns by subtracting column means
C = A - M
print(C)
# calculate covariance matrix of centered matrix
V = cov(C.T)
print(V)
# eigendecomposition of covariance matrix
values, vectors = eig(V)
print(vectors)
print(values)
# project data
P = vectors.T.dot(C.T)
print(P.T)
Output:
[[1 2]
 [3 4]
 [5 6]]

[[ 0.70710678 -0.70710678]
 [ 0.70710678  0.70710678]]

[ 8.  0.]

[[-2.82842712  0.        ]
 [ 0.          0.        ]
 [ 2.82842712  0.        ]]
Kết.
- Đây chỉ bài viết mang mục đích giới thiệu, hy vọng các bạn có cái nhìn tổng quan về nó,


Reference:
All rights reserved
