Các kỹ thuật Dimensionality Reduction
Bài đăng này đã không được cập nhật trong 4 năm
Introduction
Với kỷ nguyên dữ liệu như hiện nay, một tập dữ liệu high-dimension (đa chiều) với hàng nghìn feature hay cột đã trở thành điều không quá xa lạ. High-dimension data mở hướng cho nhiều cách xử lý các bài toán phức tạp trong thực tế, có thể kể đến dự đoán cấu trúc protein liên quan COVID-19, phân tích hình ảnh MEG scan não, v.v. Tuy nhiên, một tập dữ liệu high-dimension lại thường chứa các feature kém (không đóng góp nhiều vào kết quả) dẫn đến việc giảm hiệu năng của mô hình. Và việc lựa chọn trong rất nhiều feature để chọn ra feature có ảnh hưởng lớn đến kết quả cũng trở nên khó khăn hơn.
Một phương pháp thường được áp dụng là kỹ thuật dimensional reduction (hay giảm chiều dữ liệu  nghe khá hiển nhiên). Ưu điểm của phương pháp này bao gồm:
- Cải thiện độ chính xác của model do giảm thiểu điểm dữ liệu dư thừa, nhiễu
- Model huấn luyện nhanh hơn (do dimension đã giảm) và giảm tài nguyên sử dụng để tính toán.
- Kết quả của mô hình có thể được phân tích dễ dàng hơn
- Giảm overfitting trong nhiều trường hợp. Với quá nhiều feature trong dữ liệu, mô hình trở nên phức tạp và có xu hướng overfit trên tập huấn luyện
- Dễ dàng hơn trong việc visualize dữ liệu (plot trên miền 2D hay 3D)
- Giảm thiểu trường hợp multicolinearity (đa cộng tuyến tính). Trong các bài toán regression, multicolinearity xảy ra khi các biến độc lập trong mô hình phụ thuộc tuyến tính lẫn nhau
Các phương pháp thường chia thành hai hướng:
- Feature Selection: lựa chọn và giữ lại các feature tốt
- Feature Extraction (hay dimensionality reduction): Giảm chiều dữ liệu bằng các kết hợp các feature đang có
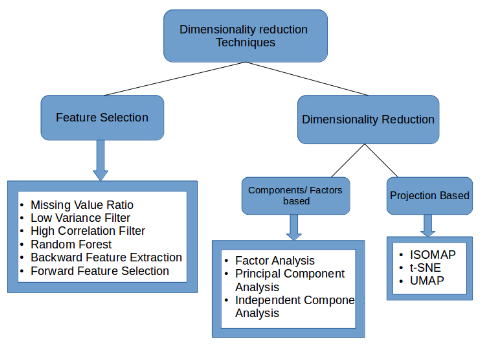
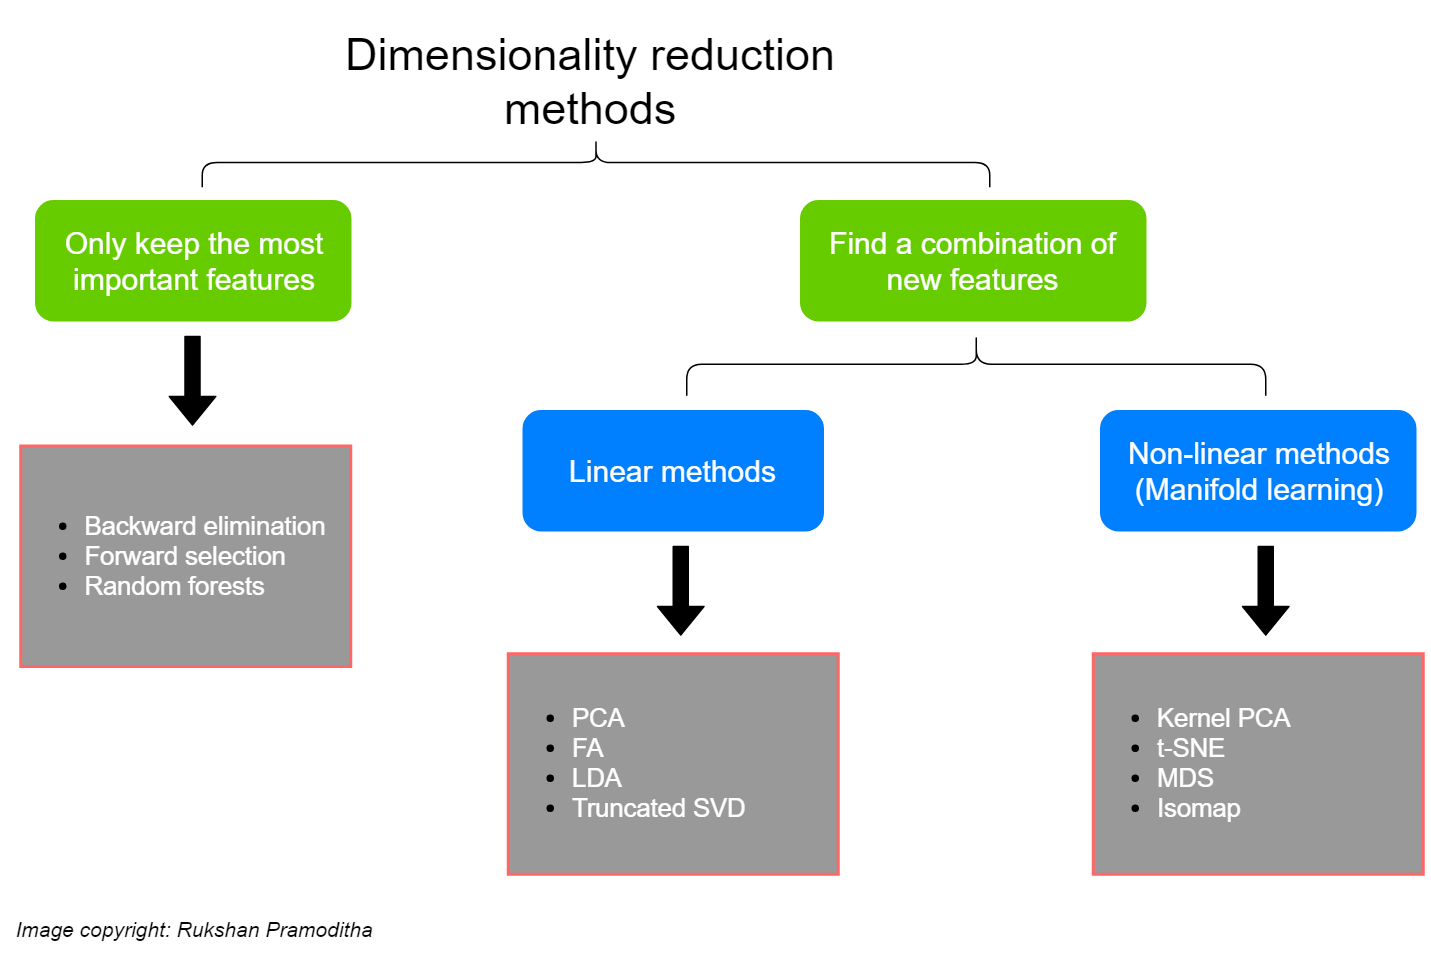
Trong đó cách thứ hai thường chia thành phương pháp linear và non-linear (hay manifold learning)
1. Feature Selection + Elimination
Phương pháp dễ hiểu và thực hiện nhất. Một vài phương pháp phổ biến thường được dùng có thể kể đến như
- Missing values ratio: Các cột hay feature thiếu nhiều giá trị sẽ hầu như không đóng góp vào mô hình machine learning. Vì vậy, việc chọn feature bỏ có thể dựa trên threshold tỉ lệ giá trị missing của feature đó. Giá trị threshold càng cao thì độ reduction càng lớn.
import pandas as pd

df = pd.read_csv('ANSUR.csv')
missing_values=df.isnum().sum()/len(def)*100

ratios = [ratio for ratio in (df.isna().sum()/len(df))]
print([pair for pair in list(zip(df.columns, ratios)) if pair[1] > 0])

variable = [ ]

for i in range(df.columns.shape[0]):
    if a[i]<=40: #setting the threshold as 40%
        variable.append(variables[i])

new_data = df[variable]
- Low-variance filter: Feature có variance (phương sai) thấp sẽ không đóng góp nhiều trong mô hình. Vậy tương tự cách trên, nếu dưới threshold nhất định thì sẽ loại bỏ feature đó.
from sklearn.preprocessing import normalize

variance = df.var()
variable = [ ]

for i in range(0,len(variance)):
    if variance[i]>=0.006: #setting the threshold as 1%
        variable.append(columns[i])

new_data = df[variable]
- High-correlation filter Các feature nếu có sự tương quan có thể được coi như nhau trong mô hình. Điều này khiến việc tồn tại nhiều feature giống nhau không cần thiết. Nếu giữ lại nhiều feature tương quan sẽ giảm hiệu năng mô hình đáng kể (đặc biệt các mô hình linear hay logistic regression).
import numpy as np
from sklearn.preprocessing import normalize
import pandas as pd

norm = normalize(df)
df_norm = pd.DataFrame.from_records(norm, columns=df.columns)

corr_matrix = df_norm.corr().abs()

mask = np.triu(np.ones_like(corr_matrix, dtype=bool))
tri_df = corr_matrix.mask(mask)

results = {}
for i in np.linspace(0.85,0.99,15):
    i = round(i,2)
    to_drop = [c for c in tri_df.columns if any(tri_df[c] >= i)]

    reduce_high_corr_df = df.drop(to_drop, axis=1)
    reduce_high_corr_df = reduce_high_corr_df.drop('Component', axis=1)

    mean = rfc_mean(reduce_high_corr_df, df['Component'])

    results[i] = round(mean,4)

high_acc = max(results, key=results.get)

print(results)
print("Correlation coefficient with the highest predictive accuracy ", high_acc)

to_drop = [c for c in tri_df.columns if any(tri_df[c] >= 0.88)]
print("Number of feature's dropped ",len(to_drop))
- Random Forest: Phương pháp này cũng tương đối phổ biến và có ích. Việc sử dụng decision tree có thể tận dụng lợi thế thống kê học để tìm ra feature chứa nhiều thông tin để giữ lại nhất. Thuật toán random forest (sklearn) chỉ nhận giá trị số, nên cần phải hot encoding.
from sklearn.model_selection import train_test_split
from sklearn.ensemble import RandomForestClassifier
from sklearn.metrics import accuracy_score

def rfc_test_accuracy(X, y):
    """
    Function which takes the predictor and target variables and returns the test accuracy of the model.
    """
    X_train, X_test, y_train, y_test = train_test_split(X, y, test_size=0.2)

    RFC = RandomForestClassifier(random_state=123)
    RFC.fit(X_train,y_train)

    test_accuracy = accuracy_score(y_test, RFC.predict(X_test))

    return test_accuracy

def rfc_mean(X,y,trails=20):
    """
    Print the mean value of Random forest classifier for n trails.
    """
    result = [rfc_test_accuracy(X,y) for i in range(trails)]
    mean = np.array(result).mean()

    return mean


print("Predictive accuracy of base random forrest classifier ",round(rfc_mean(df.drop('Component', axis=1),df['Component']),3))
- Backwards-feature elimination: Tiếp cận hướng top down, bắt đầu với tất cả feature, và loại bỏ từng feature cho đến hết.
from sklearn.model_selection import train_test_split
from sklearn.ensemble import RandomForestClassifier
from sklearn.metrics import accuracy_score
import matplotlib.pyplot as plt

def MAN_RFE(X,df,trails=20):

    accuracy = []
    for i in range(df.shape[1],1,-1):

        X_train, X_test, y_train, y_test = train_test_split(X, df['Component'],
                                                            test_size=0.2, random_state=123)

        for j in range(trails):
            rfe = RandomForestClassifier()
            rfe.fit(X_train, y_train)

            acc = accuracy_score(y_test, rfe.predict(X_test))
            accuracy.append(acc)


        feat_import = dict(zip(X.columns, rfe.feature_importances_))
        X = X.drop(min(feat_import, key=feat_import.get), axis=1)

    return list(np.array(accuracy).reshape(100,20))


df_no_com = df.drop('Component',axis=1)
accuracy = MAN_RFE(df_no_com, df)

plt.figure(figsize=(20, 6))
plt.boxplot(accuracy, sym="")
plt.ylim(0.5,0.7)
plt.xticks(rotation = 90)
plt.xlabel('Number of features removed')
plt.ylabel('Accuracy')
plt.show()
Có thể tham khảo cụ thể hơn tại đây
- Forward Feature Selection: Ngược lại phương pháp trước, từ một feature và tăng dần các feature tới khi mô hình đạt giá trị tối ưu.
from sklearn.feature_selection import f_regression
f_val, p_val = f_regression(X_train, y_train)
hoặc mlxtend
from mlxtend.feature_selection import SequentialFeatureSelector as sfs
from sklearn.linear_model import LinearRegression

lreg = LinearRegression()
sfs1 = sfs(lreg, k_features=3, forward=True, verbose=2, scoring='neg_mean_squared_error')

sfs1 = sfs1.fit(X, y)
Lưu ý là cả Backward Feature Elimination và Forward Feature Selection đều rất tốn thời gian và tài nguyên tính toán. Nên phương pháp chỉ thường chỉ sử dụng với các tập dữ liệu nhỏ, không nhiều feature.
Ngoài ra thư viện scikit-learn cũng support một vài method tự động cho để chọn các feature tốt như Univariate Selection, recursive feature elimination...
Với Feature Extraction, hãy sử dụng tập dữ liệu lớn hơn chút Fashion MNIST để thử nghiệm. Tập dữ liệu này bao gồm 70,000 ảnh với 60,000 ảnh train và 10,000 ảnh test.
2. Phương pháp Linear
Với Feature extraction, bộ dữ liệu FashionMNIST được sử dụng để visualize tốt hơn. Chắc data này không còn lạ lẫm và hoàn toàn có thể tìm thấy trên google. Tuy nhiên mình cũng để 1 file link drive để tiện cho việc sử dụng với colab hơn nếu các bạn cần. Here
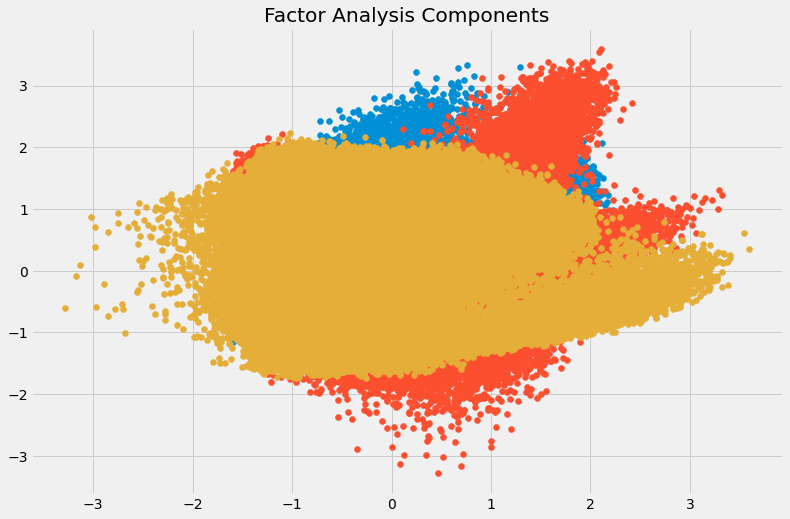
- Factor Analysis: Các biến được gộp thành nhóm chung theo correlation. Mỗi nhóm này được coi như là một factor, với số lượng factor nhỏ hơn số chiều gốc của tập dữ liệu. Tuy nhiên điểm trừ là hơi khó quan sát sự tách biệt giữa các factor khi visualize
import pandas as pd
import numpy as np
from glob import glob
import cv2

# Load data
images = [cv2.imread(file) for file in glob('train/*.png')]

images = np.array(images)
image = []
for i in range(0,60000):
    img = images[i].flatten()
    image.append(img)
image = np.array(image)

train = pd.read_csv("train.csv")     # Give the complete path of your train.csv file
feat_cols = [ 'pixel'+str(i) for i in range(image.shape[1]) ]
df = pd.DataFrame(image,columns=feat_cols)
df['label'] = train['label']

# Factor Analysis
from sklearn.decomposition import FactorAnalysis
FA = FactorAnalysis(n_components = 3).fit_transform(df[feat_cols].values)

# Visualize
%matplotlib inline
import matplotlib.pyplot as plt
plt.figure(figsize=(12,8))
plt.title('Factor Analysis Components')
plt.scatter(FA[:,0], FA[:,1])
plt.scatter(FA[:,1], FA[:,2])
plt.scatter(FA[:,2],FA[:,0])
- Principal component analysis: aka PCA. Đây là một thuật toán unsupervised giúp giảm chiều dữ liệu và vẫn giữ được nhiều thông tin nhất có thể. Thường được sử dụng với kiểu dữ liên tục: PCA xoay và chiếu điểm dữ liệu theo chiều tăng của phương sai
PCA có thể hiểu là một quy trình thống kê trong đó phép biến đổi trực giao tập dữ liệu chiều thành chiều principal component.
PCA là thuật toán giảm chiều tuyến tính bằng cách biến đổi các biến tương quan (p) trở thành các biến k không ràng buộc (với k<p) được gọi là principal components. Các biến này sẽ tôi đa hóa việc lưu giữ nhiều thông tin của tập dữ liệu nguồn.
Tham khảo thêm bài này để hiểu kỹ hơn về PCA. Nhưng nhìn chung tóm tắt lại ý chính PCA:
- Một principal component là tổ hợp tuyến tính của các biến
- Các pricipal component được tạo thành với mục tiêu như sau
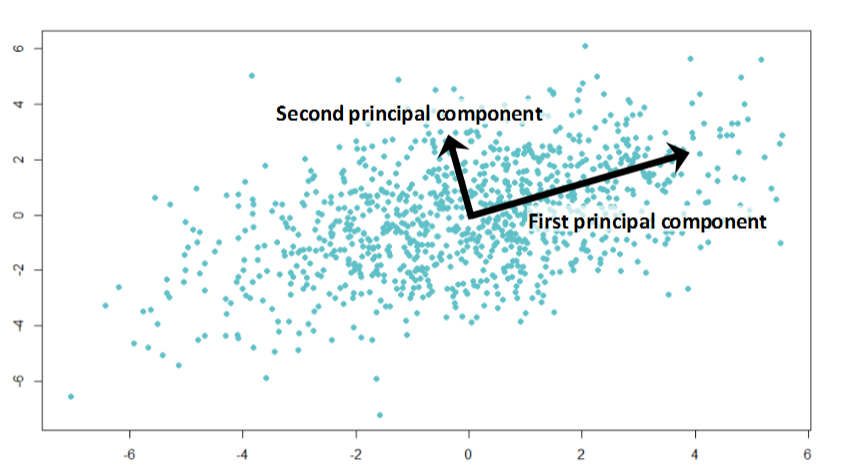
- Principal component (đầu) cố gắng biểu diễn phương sai lớn nhất của dữ liệu. Trong đó xác định hướng biến đổi lớn nhất của dữ liệu (aka dữ liệu ảnh hưởng nhất). Biến đổi càng lớn thì lượng thông tin component biểu diễn được càng nhiều.
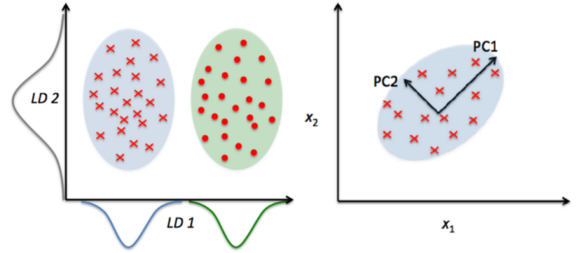
- Principal component tiếp theo sẽ cho thấy phương sai còn lại của tập dữ liệu mà không tương quan với PC1 (hay correlation bằng 0) và vì thế, hướng của 2 PC sẽ trực giao (hình ảnh).
- Principal component thứ ba và sau đó tương tự
from sklearn.decomposition import PCA
pca = PCA(n_components=4)
pca_result = pca.fit_transform(df[feat_cols].values)

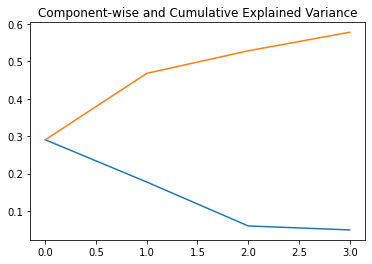
plt.plot(range(4), pca.explained_variance_ratio_)
plt.plot(range(4), np.cumsum(pca.explained_variance_ratio_))
plt.title("Component-wise and Cumulative Explained Variance")
import seaborn as sns
plt.style.use('fivethirtyeight')

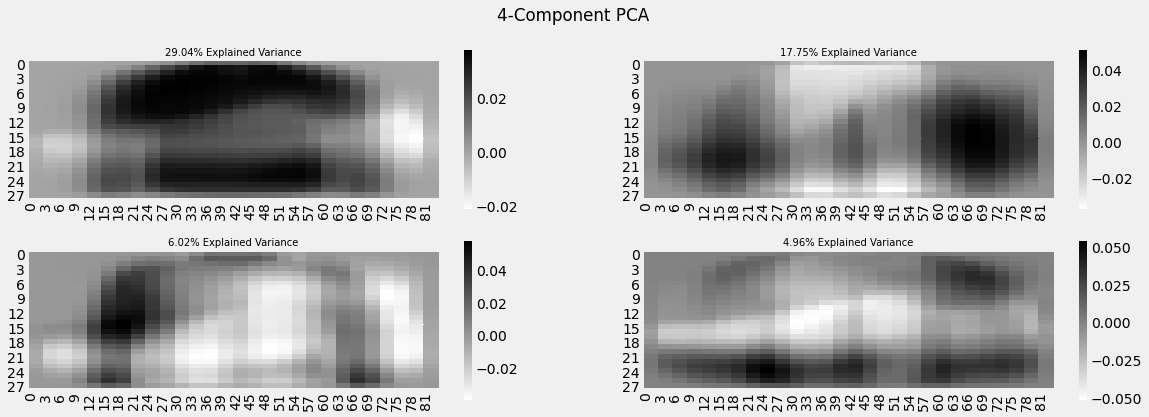
fig, axarr = plt.subplots(2, 2, figsize=(12, 8))
sns.heatmap(pca.components_[0, :].reshape(28, 84), ax=axarr[0][0], cmap='gray_r')
sns.heatmap(pca.components_[1, :].reshape(28, 84), ax=axarr[0][1], cmap='gray_r')
sns.heatmap(pca.components_[2, :].reshape(28, 84), ax=axarr[1][0], cmap='gray_r')
sns.heatmap(pca.components_[3, :].reshape(28, 84), ax=axarr[1][1], cmap='gray_r')
axarr[0][0].set_title(
"{0:.2f}% Explained Variance".format(pca.explained_variance_ratio_[0]*100),
fontsize=12
)
axarr[0][1].set_title(
"{0:.2f}% Explained Variance".format(pca.explained_variance_ratio_[1]*100),
fontsize=12
)
axarr[1][0].set_title(
"{0:.2f}% Explained Variance".format(pca.explained_variance_ratio_[2]*100),
fontsize=12
)
axarr[1][1].set_title(
"{0:.2f}% Explained Variance".format(pca.explained_variance_ratio_[3]*100),
fontsize=12
)
axarr[0][0].set_aspect('equal')
axarr[0][1].set_aspect('equal')
axarr[1][0].set_aspect('equal')
axarr[1][1].set_aspect('equal')

plt.suptitle('4-Component PCA')
- Linear Discriminatory Analysis: Kỹ thuật supervised, mục tiêu nhắm tới việc giữ nhiều nhất tính chất quyết định phân loại của các biến phụ thuộc. Thuật toán LDA tính toán khả năng phân biệt các lớp, sau đó tính khoảng cách giữa các mẫu của mỗi lớp cùng với trung bình. Cuối cùng đưa tập dữ liệu về chiều nhỏ hơn.
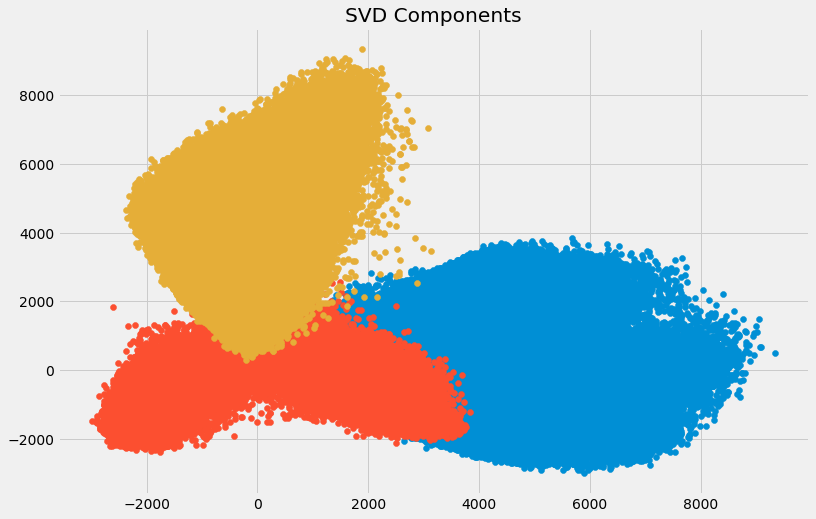
- Singular Value Composition:. SVD trích xuất feature quan trọng nhất khỏi tập dữ liệu. Phương pháp này khá phổ biến vì dựa trên mô hình toán học tuyến tính. Nhìn chung SVD sẽ tận dụng trị riêng và vector riêng để xác định và tách các biến thành 3 ma trận với mục đích loại bỏ các feature ít quan trọng trong tập dữ liệu.
from sklearn.decomposition import TruncatedSVD
svd = TruncatedSVD(n_components=3, random_state=226).fit_transform(df[feat_cols].values)

plt.figure(figsize=(12,8))
plt.title('SVD Components')
plt.scatter(svd[:,0], svd[:,1])
plt.scatter(svd[:,1], svd[:,2])
plt.scatter(svd[:,2],svd[:,0])
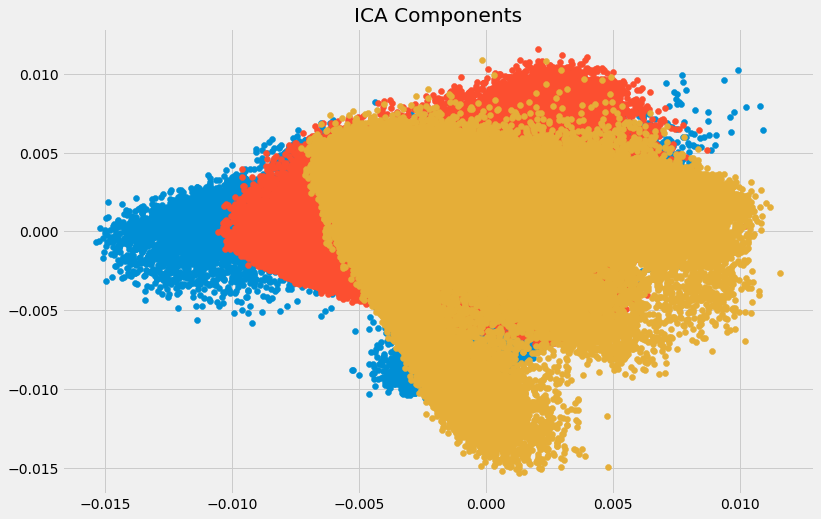
Independent Component Analysis: ICA phương pháp này dựa trên lý thuyết truyền ti và cũng là 1 một phương pháp rất phổ biến. PCA sẽ tìm các yếu tố ít tương quan trong khi ICA chú trọng vào các biến độc lập
from sklearn.decomposition import FastICA
ICA = FastICA(n_components=3, random_state=12)
X=ICA.fit_transform(df[feat_cols].values)

plt.figure(figsize=(12,8))
plt.title('ICA Components')
plt.scatter(X[:,0], X[:,1])
plt.scatter(X[:,1], X[:,2])
plt.scatter(X[:,2], X[:,0])
3. Manifold learning hay non-linear method
Một hướng tiếp cận khác theo phi tuyến tính (hay dùng projection-phương pháp chiếu) là manifold learning. Có thể hiểu đơn giản là tận dụng đặc tính hình học để chiếu các điểm xuống chiều không gian thấp hơn mà vẫn giữ được đặc trưng của dữ liệu.
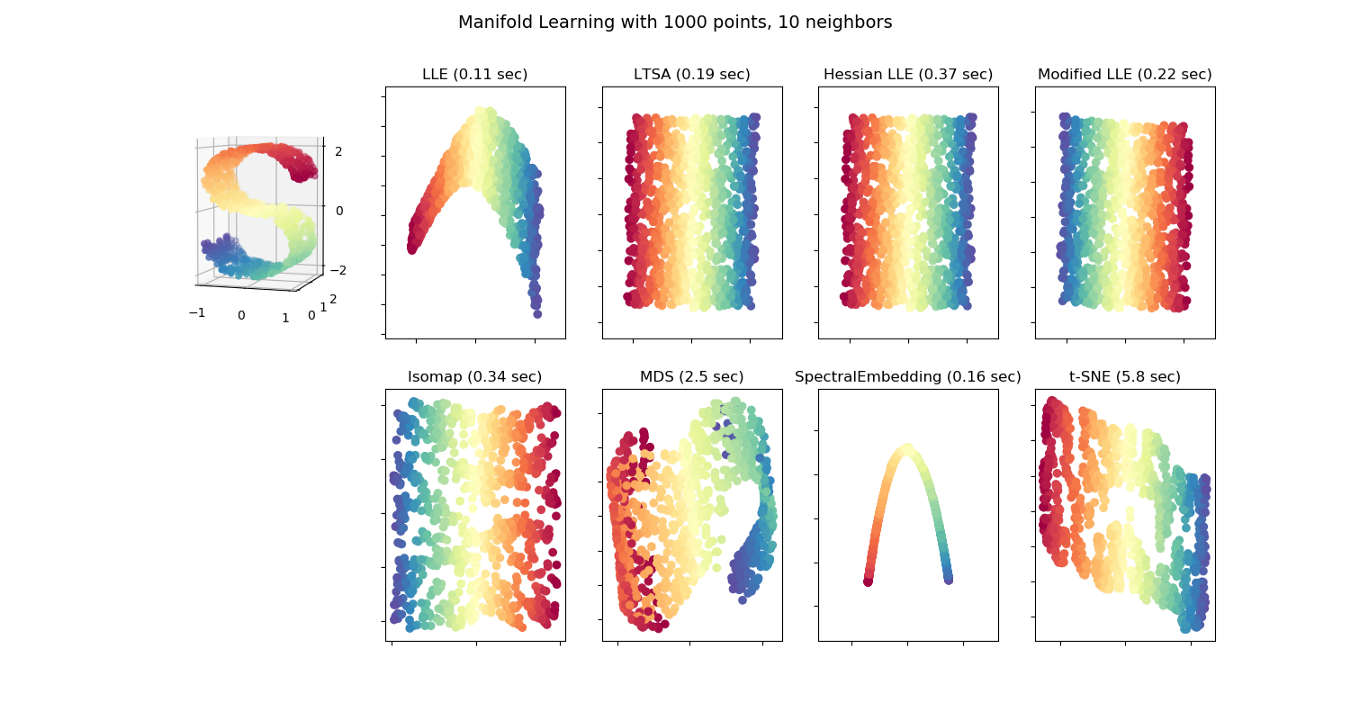
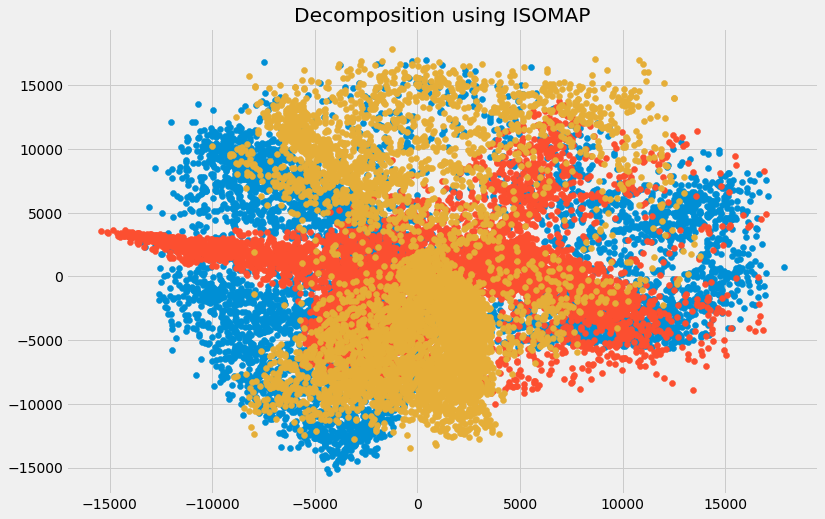
- Isometric Feature Mapping (Isomap): Phương pháp này bảo toàn được mối liên hệ của tập dữ liệu bằng cách tạo ra tập dữ liệu embedded. Đầu tiên, thuật toán tạo ra mạng lân cận, ước lượng khoảng cách trắc địa, khoảng cách ngắn nhất giữa hai điểm trên bề mặt cong, giữa tất cả các điểm. Và cuối cùng, bằng việc sử dụng phân rã trị riêng của ma trận khoảng cách Geodesic, tập dữ liệu với số chiều nhỏ hơn được tạo ra
from sklearn import manifold
trans_data = manifold.Isomap(n_neighbors=5, n_components=3, n_jobs=-1).fit_transform(df[feat_cols][:6000].values)

plt.figure(figsize=(12,8))
plt.title('Decomposition using ISOMAP')
plt.scatter(trans_data[:,0], trans_data[:,1])
plt.scatter(trans_data[:,1], trans_data[:,2])
plt.scatter(trans_data[:,2], trans_data[:,0])
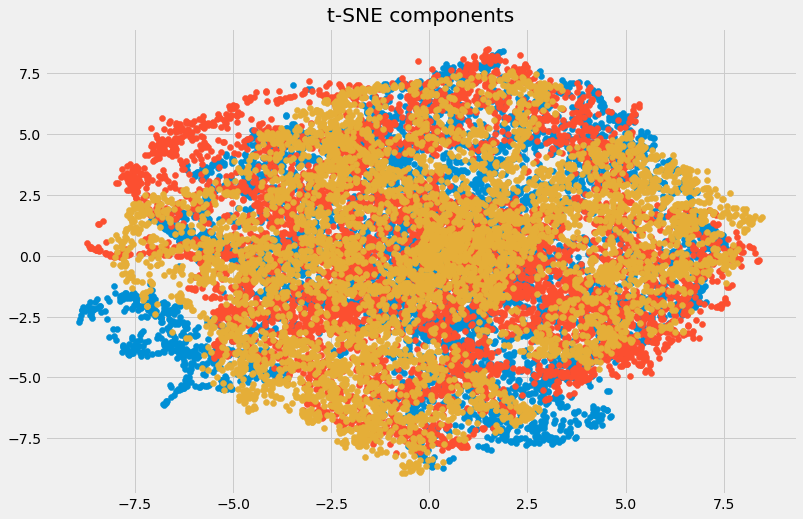
- t-Distributed Stochastic Neighbour (t-SNE): rất nhạy với các cấu trúc local. t-SNE thường được sử dụng với mục đích visualize dữ liệu nhằm giúp hiểu được thuộc tính lý thuyết của tập dữ liệu. Tuy nhiên đây cũng là phương pháp đòi hỏi hiệu năng tính toán cao và cũng cần được áp dụng các kỹ thuật khác như missing values ratio hoặc scale feature.
from sklearn.manifold import TSNE
tsne = TSNE(n_components=3, n_iter=300).fit_transform(df[feat_cols][:6000].values)

plt.figure(figsize=(12,8))
plt.title('t-SNE components')
plt.scatter(tsne[:,0], tsne[:,1])
plt.scatter(tsne[:,1], tsne[:,2])
plt.scatter(tsne[:,2], tsne[:,0])
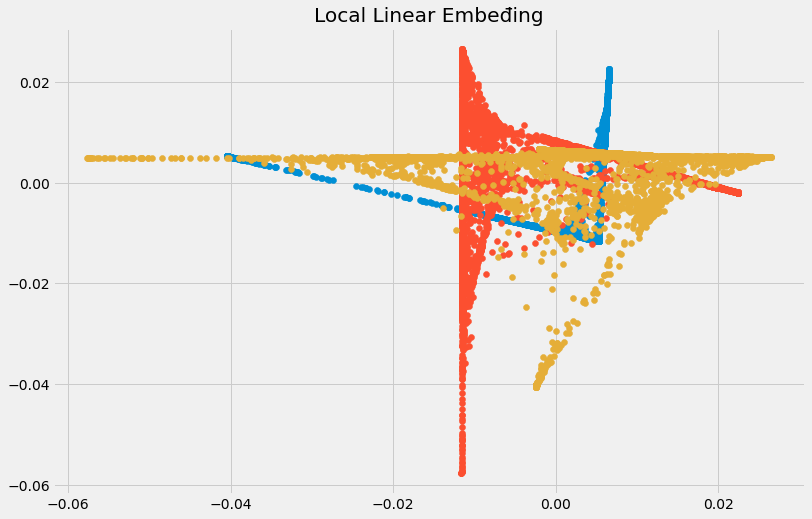
- Locally linear embedding (LLE). Cũng với ý tưởng tương tự Isomap, nhưng LLE tìm k-NN của các điểm; ước lượng mỗi điểm vector dữ liệu như là tổ hợp của kNN. Sau đó tạo ra các vector ít chiều hơn để 'copy' lại các trọng số ở trên. Nhìn chung phương pháp này có thể phát hiện được nhiều feature hơn phương pháp tuyến tính thông thường, và hiệu quả hơn các phương pháp khác.
from sklearn.manifold import LocallyLinearEmbedding
embedding = LocallyLinearEmbedding(n_components=3).fit_transform(df[feat_cols][:6000].values)

plt.figure(figsize=(12,8))
plt.title('Local Linear Embeđing')
plt.scatter(embedding[:,0], embedding[:,1])
plt.scatter(embedding[:,1], embedding[:,2])
plt.scatter(embedding[:,2], embedding[:,0])
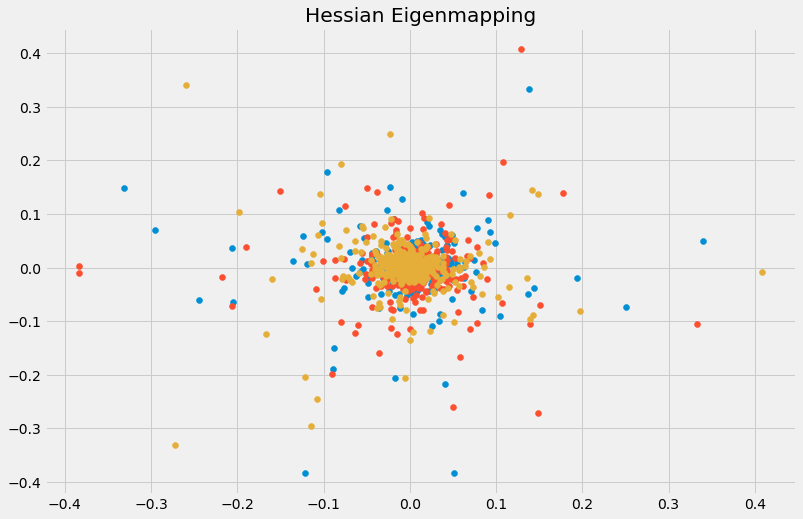
- Hessian Eigenmapping (HLLE): Chiếu điểm dữ liệu xuống chiều thấp hơn và bảo toàn các điểm local giống như LLE nhưng phương pháp tiếp cận sử dụng Hessian matrix
Dùng Hessian matrix thì cũng sử dụng LocallyLinearEmbeg dding của sklearn, với nhớ truyền tham số method='hessian' và tham số n_neighbors phải lớn hơn [n_components * (n_components + 3) / 2] là ok.
from sklearn.manifold import LocallyLinearEmbedding
HeissianEigenmapping = LocallyLinearEmbedding(eigen_solver='dense', n_components=3, n_neighbors=10,method='hessian', random_state=226).fit_transform(df[feat_cols][:6000].values)

plt.figure(figsize=(12,8))
plt.title('Heissian Eigenmapping')
plt.scatter(HeissianEigenmapping[:,0], HeissianEigenmapping[:,1])
plt.scatter(HeissianEigenmapping[:,1], HeissianEigenmapping[:,2])
plt.scatter(HeissianEigenmapping[:,2], HeissianEigenmapping[:,0])
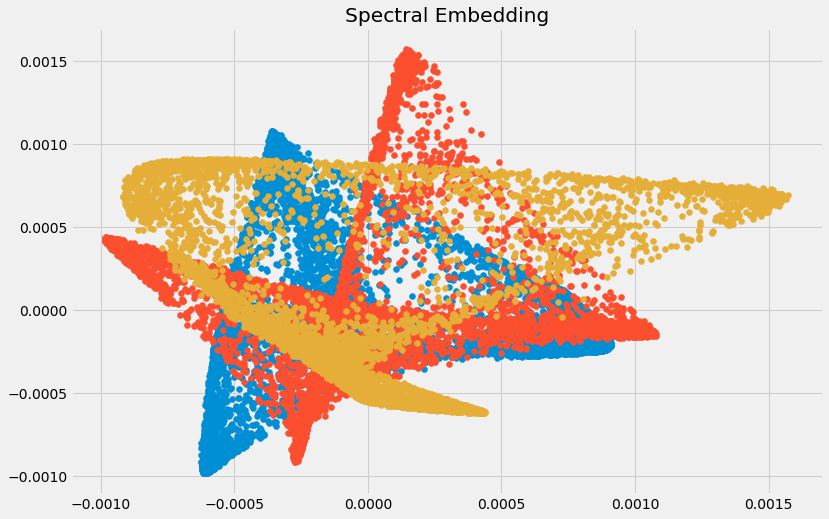
- Spectral Embedding: sử dụng kỹ thụât spectral (phổ) để mapping dữ liệu xuống chiều thấp hơn, ưu tiên các điểm gần nhau hơn là tuyến tính cận nhau.
from sklearn.manifold import SpectralEmbedding
spectralEmbedding = SpectralEmbedding(n_components=3, random_state=226).fit_transform(df[feat_cols][:6000].values)

plt.figure(figsize=(12,8))
plt.title('Spectral Embedding')
plt.scatter(spectralEmbedding[:,0], spectralEmbedding[:,1])
plt.scatter(spectralEmbedding[:,1], spectralEmbedding[:,2])
plt.scatter(spectralEmbedding[:,2], spectralEmbedding[:,0])
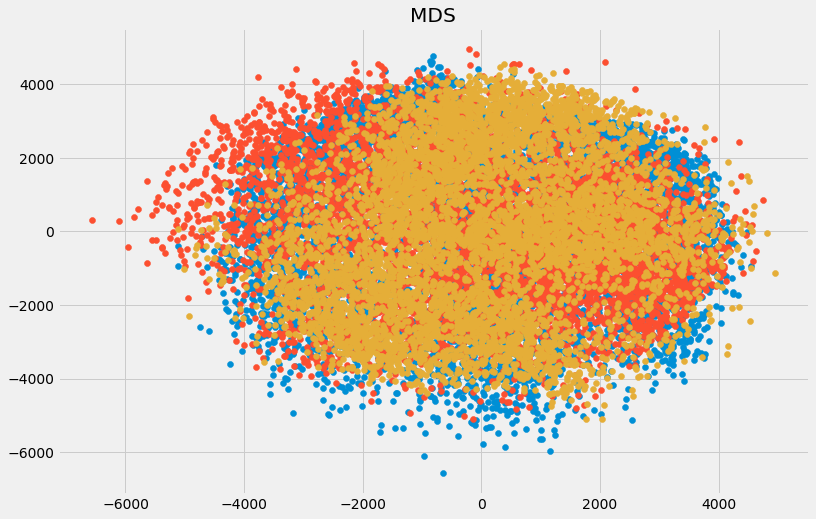
- Multidimensional scaling (MDS):
from sklearn.manifold import MDS
mds = MDS(n_components=3, random_state=226).fit_transform(df[feat_cols][:6000].values)

plt.figure(figsize=(12,8))
plt.title('MDS')
plt.scatter(mds[:,0], mds[:,1])
plt.scatter(mds[:,1], mds[:,2])
plt.scatter(mds[:,2], mds[:,0])
Summary
Không có phương pháp nào là 'bá đạo' cả, việc chọn method phù hợp phụ thuộc rất nhiều yếu tố, tính chất tập dữ liệu và kết hợp giữa các kỹ thuật khác nhau, từ đó tìm ra phương pháp tốt nhất.
Và ngoài các điều trên, các kỹ thuật Dimensionality Reduction còn một vài hạn chế chung có thể kể đến như: mất mát dữ liệu khi giảm số chiều, trong kỹ thuật PCA, đôi khi không principal components cần thiết lại chưa được rõ ràng...
Code Colab tham khảo.
Trên đây là những phần mình tìm hiểu và sưu tầm được. Xin cám ơn các bạn đã quan tâm và theo dõi bài viết ^.^
References
[2] https://towardsdatascience.com/dimensionality-reduction-for-machine-learning-80a46c2ebb7e
[3] https://machinelearningmastery.com/dimensionality-reduction-for-machine-learning/
[4] https://towardsdatascience.com/techniques-for-dimensionality-reduction-927a10135356
[5] https://www.analyticsvidhya.com/blog/2018/08/dimensionality-reduction-techniques-python/
[6] https://gist.github.com/Amitdb123/1e191a36d1f36b7bdfcf13375e63694b#file-dimensionality_reduction-py
[8] https://www.kaggle.com/mtax687/explorations-of-fashion-mnist-dataset
[9] https://www.analyticsvidhya.com/blog/2017/05/comprehensive-guide-to-linear-algebra/
All rights reserved
