Banking Demo — Phase 3: Monitoring và Auto Scale — Prometheus, Grafana, KEDA
Bài 6/11: Monitoring và Auto Scale — Phase 3
Mở đầu
Ở bài 4, 5, chúng ta đã có Helm chart và ArgoCD: Banking Demo chạy trên Kubernetes, cấu hình trong Git, sync là deploy. Tiếp theo cần quan sát hệ thống (metric, log, trace) và tự động scale khi tải tăng.
Phase 3 bổ sung monitoring (Prometheus, Grafana, Loki, Tempo) và auto scale (KEDA): thu thập metric từ các service, hiển thị dashboard, scale Deployment theo RPS (rate http_requests_total) thay vì chỉ CPU. Bài này mô tả luồng Phase 3: cài monitoring stack bằng Helm, cài KEDA và ScaledObject, load test để kiểm chứng scale.
Repo : https://github.com/kevinram164/banking-demo.git
Luồng tổng quan
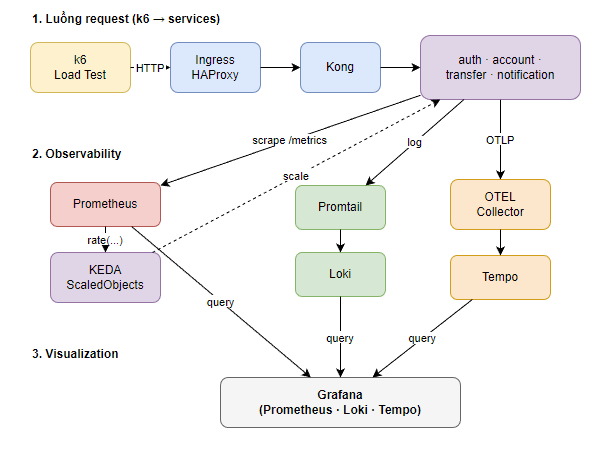
| Thành phần | Vai trò |
|---|---|
| Prometheus | Thu thập metric (scrape /metrics từ services, Kong, exporters). |
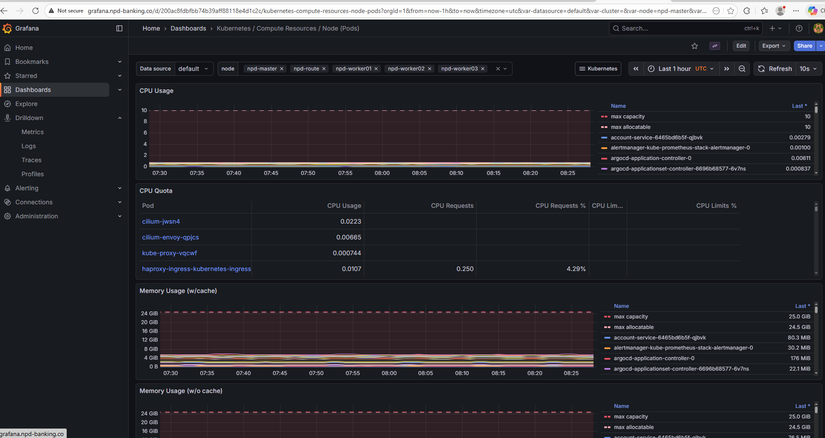
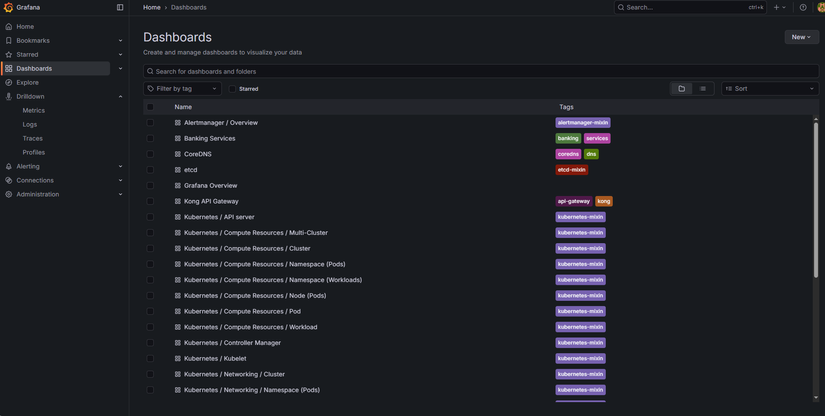
| Grafana | Dashboard, query Prometheus / Loki / Tempo. |
| Loki | Lưu log (Promtail gửi log pod → Loki). |
| Promtail | Đọc log pod, gửi Loki. |
| Tempo | Lưu trace (OTEL Collector nhận OTLP từ app → Tempo). |
| KEDA | Scale Deployment theo Prometheus metric (vd: RPS). |
Lý thuyết nền: Observability — Metrics, Logs, Traces
Observability (khả năng quan sát) thường được mô tả bằng :
| STT | Mô tả | Trong Phase 3 |
|---|---|---|
| Metrics | Số đo theo thời gian (RPS, latency, CPU, memory). Trả lời "hệ thống chạy thế nào?". | Prometheus scrape /metrics → Grafana dashboard. |
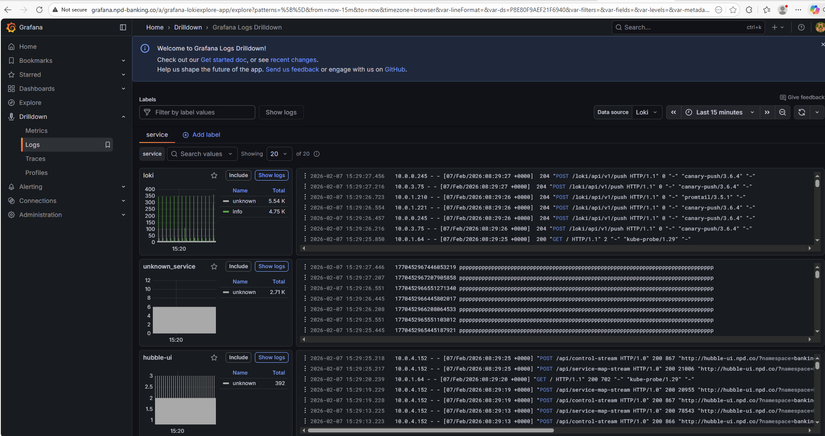
| Logs | Sự kiện dạng text (log ứng dụng, log pod). Trả lời "chuyện gì đã xảy ra?". | Promtail thu log pod → Loki; Grafana query Loki. |
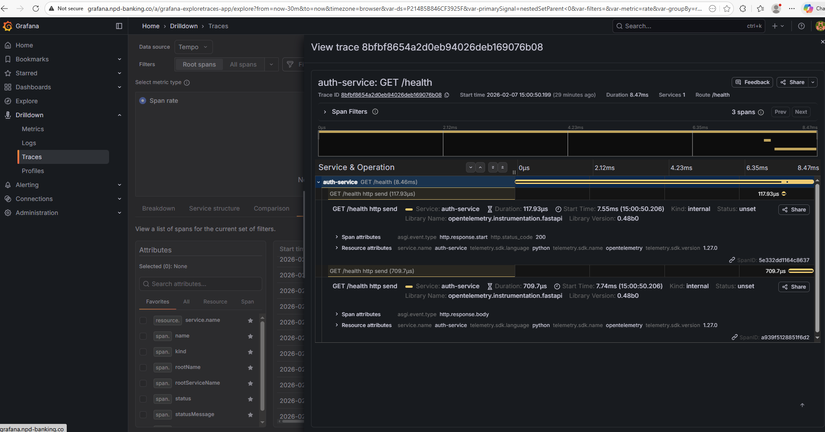
| Traces | Đường đi request qua nhiều service (span, trace ID). Trả lời "request đi đâu, mất thời gian ở đâu?". | App gửi OTLP → OTEL Collector → Tempo; Grafana query Tempo. |
Cả ba bổ sung cho nhau: metric cho biết "auth-service P95 tăng", log cho biết "lỗi connection refused", trace cho biết "request dừng lâu ở transfer-service". Phase 3 triển khai đủ ba trụ để vừa theo dõi hiệu năng vừa debug khi sự cố.
Cấu trúc Phase 3 trong repo
phase3-monitoring-keda/
├── PHASE3.md                 # Tổng quan Phase 3
├── PHASE3-FLOW.md            # Sơ đồ luồng (Mermaid)
├── helm-monitoring/          # Monitoring + Logging + Tracing (Helm)
│   ├── README.md
│   ├── values-kube-prometheus-stack.yaml   # Prometheus + Grafana
│   ├── values-loki.yaml
│   ├── values-promtail.yaml
│   ├── values-tempo.yaml
│   └── values-otel-collector.yaml
├── keda/                     # KEDA + ScaledObjects
│   ├── README.md
│   ├── scaledobject-auth.yaml
│   ├── scaledobject-account.yaml
│   ├── scaledobject-transfer.yaml
│   └── scaledobject-notification.yaml
├── hpa/                      # (Tùy chọn) HPA theo CPU/Memory
└── load-test/                # k6 scripts + run-scenarios.sh
Monitoring stack — Helm
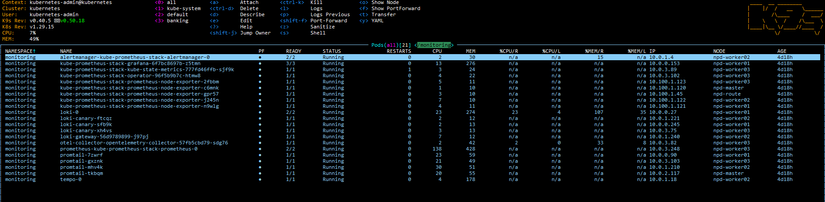
Phase 3 triển khai monitoring bằng Helm: pull chart, sửa values, helm install/upgrade. Thứ tự cài (namespace monitoring):
- Kube Prometheus Stack — Prometheus + Grafana + Alertmanager.
- Loki — backend log.
- Promtail — ship log pod → Loki.
- Tempo — backend trace.
- OpenTelemetry Collector — nhận OTLP từ app → export Tempo.
Thêm repo và cài
helm repo add prometheus-community https://prometheus-community.github.io/helm-charts
helm repo add grafana https://grafana.github.io/helm-charts
helm repo add open-telemetry https://open-telemetry.github.io/opentelemetry-helm-charts
helm repo update

kubectl create namespace monitoring

helm upgrade --install kube-prometheus-stack prometheus-community/kube-prometheus-stack \
  -n monitoring -f phase3-monitoring-keda/helm-monitoring/values-kube-prometheus-stack.yaml

helm upgrade --install loki grafana/loki -n monitoring \
  -f phase3-monitoring-keda/helm-monitoring/values-loki.yaml
helm upgrade --install promtail grafana/promtail -n monitoring \
  -f phase3-monitoring-keda/helm-monitoring/values-promtail.yaml

helm upgrade --install tempo grafana/tempo -n monitoring \
  -f phase3-monitoring-keda/helm-monitoring/values-tempo.yaml
helm upgrade --install otel-collector open-telemetry/opentelemetry-collector -n monitoring \
  -f phase3-monitoring-keda/helm-monitoring/values-otel-collector.yaml
Chi tiết từng chart (scrape config cho banking services, Kong, Redis/Postgres exporters, datasource Grafana) xem phase3-monitoring-keda/helm-monitoring/README.md.
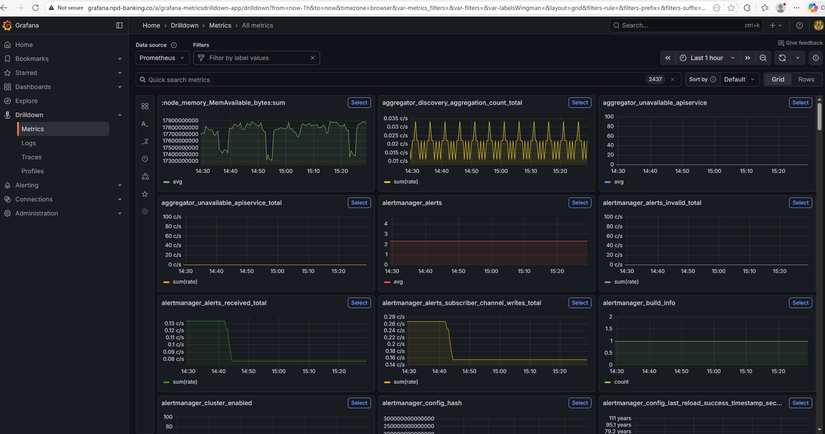
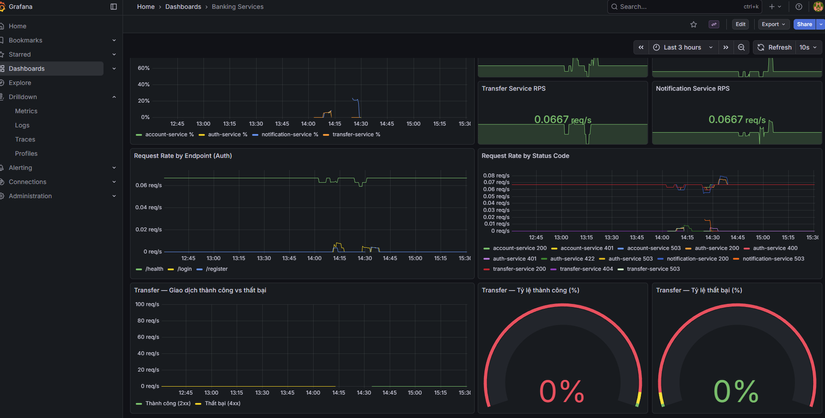
Metrics — Prometheus scrape banking services
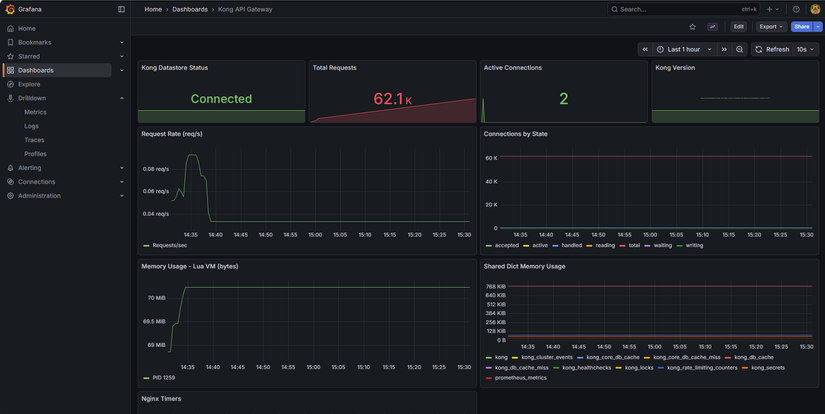
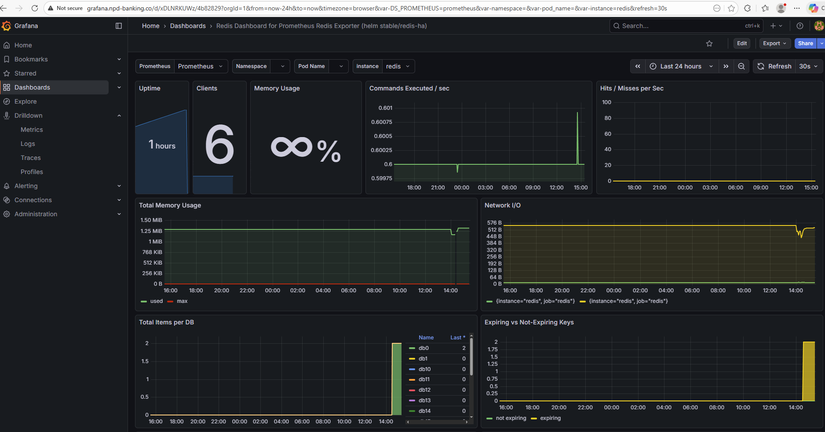
Các service (auth, account, transfer, notification) cần expose /metrics (Prometheus format). Trong values kube-prometheus-stack có additionalScrapeConfigs trỏ tới từng service trong namespace banking (vd: auth-service.banking.svc.cluster.local:8001/metrics). Kong có thể bật Prometheus plugin và scrape qua kong.banking.svc.cluster.local:8001/metrics. Redis và PostgreSQL thu qua exporters (xem phase3-monitoring-keda/exporters/).
Metric quan trọng cho KEDA: http_requests_total — số request theo job/label. KEDA dùng rate (vd: sum(rate(http_requests_total{job="auth-service"}[2m]))) làm giá trị để so sánh với ngưỡng scale.
Latency và percentiles (P50, P95, P99)
Khi đánh giá hiệu năng API, average (trung bình) dễ bị kéo lên bởi vài request rất chậm (vd timeout 30s). Percentile ổn định hơn: P95 = 200ms nghĩa là 95% request có thời gian phản hồi ≤ 200ms, 5% chậm hơn.
| Percentile | Ý nghĩa | Khi nào dùng |
|---|---|---|
| P50 (median) | 50% request ≤ X ms | Trải nghiệm "điển hình" của user. |
| P95 | 95% request ≤ X ms | SLA, mục tiêu hiệu năng — phổ biến nhất. |
| P99 | 99% request ≤ X ms | Theo dõi trải nghiệm tệ nhất của ~1% request. |
Trong Phase 3:
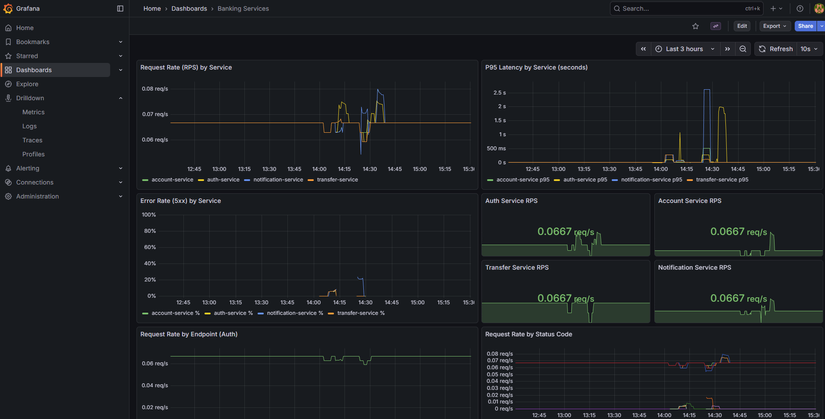
- Grafana: Panel "P95 Latency by Service" dùng PromQL kiểu
histogram_quantile(0.95, sum(rate(http_request_duration_seconds_bucket[5m])) by (job, le)). - k6: Script đặt threshold ví dụ
http_req_duration: ['p(95)<3000']— 95% request phải < 3s; vượt thì k6 báo lỗi.
Chi tiết (ví dụ minh họa, khi nào chọn P95 vs P99) xem phase3-monitoring-keda/METRICS-PERCENTILES.md.
Auto scale — KEDA
KEDA (Kubernetes Event-driven Autoscaler) scale Deployment theo metric bên ngoài (vd Prometheus), không chỉ CPU/Memory. Banking Demo dùng Prometheus scaler: query RPS từ Prometheus, nếu RPS > threshold thì tăng replica, nếu RPS < activationThreshold (và đủ điều kiện) thì giảm. https://keda.sh/docs/2.19/
Cài KEDA
helm repo add kedacore https://kedacore.github.io/charts
helm repo update
kubectl create namespace keda
helm upgrade --install keda kedacore/keda -n keda
ScaledObject (ví dụ auth-service)
apiVersion: keda.sh/v1alpha1
kind: ScaledObject
metadata:
  name: auth-service-scaler
  namespace: banking
spec:
  scaleTargetRef:
    name: auth-service
  minReplicaCount: 1
  maxReplicaCount: 5
  cooldownPeriod: 120
  triggers:
    - type: prometheus
      metadata:
        serverAddress: http://kube-prometheus-stack-prometheus.monitoring.svc.cluster.local:9090
        query: sum(rate(http_requests_total{job="auth-service"}[2m]))
        threshold: "5"
        activationThreshold: "1"
- query: RPS trung bình 2 phút cho
auth-service. - threshold: Scale up khi RPS > 5.
- activationThreshold: Scale down khi RPS < 1 (minReplicaCount vẫn được tôn trọng).
- minReplicaCount / maxReplicaCount: 1 và 5; có thể chỉnh trong từng file.
Apply ScaledObjects:
kubectl apply -f phase3-monitoring-keda/keda/scaledobject-auth.yaml
kubectl apply -f phase3-monitoring-keda/keda/scaledobject-account.yaml
kubectl apply -f phase3-monitoring-keda/keda/scaledobject-transfer.yaml
kubectl apply -f phase3-monitoring-keda/keda/scaledobject-notification.yaml
KEDA vs HPA — khi nào dùng gì?
| Tiêu chí | HPA (Horizontal Pod Autoscaler) | KEDA |
|---|---|---|
| Metric | CPU, Memory (built-in K8s) hoặc custom metric qua metrics-server. | Metric bên ngoài: Prometheus, queue (RabbitMQ, Kafka), HTTP, … |
| Use case | "Scale khi CPU > 70%" — đơn giản, không cần Prometheus. | "Scale khi RPS > 5" hoặc "scale khi queue length > 10" — linh hoạt theo nghiệp vụ. |
| Banking Demo | Có sẵn trong phase3-monitoring-keda/hpa/ nếu muốn scale theo CPU/Memory. |
Phase 3 chọn KEDA vì muốn scale theo RPS (rate http_requests_total) — phản ánh tải thực tế hơn CPU khi service nhẹ. |
Lưu ý: Không dùng cả KEDA và HPA cho cùng một Deployment; chọn một trong hai. Nếu muốn scale theo CPU/Memory thuần, dùng phase3-monitoring-keda/hpa/ thay vì KEDA.
Luồng KEDA + load test
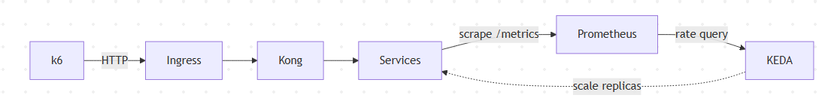
- Prometheus scrape
http_requests_totaltừ từng service. - KEDA định kỳ query (vd:
sum(rate(http_requests_total{job="auth-service"}[2m]))). - Nếu giá trị > threshold → tăng replica (tới maxReplicaCount).
- Nếu giá trị < activationThreshold (và qua cooldown) → giảm replica (tới minReplicaCount).
- Load test (k6) gửi nhiều request tới
/api/auth,/api/account,/api/transfer→ RPS tăng → KEDA scale up. Dừng k6 → RPS giảm → sau cooldown scale down.
Load test — k6
Trong repo có script k6 và run-scenarios.sh:
load-test/k6-auth.js— load/api/auth(login).load-test/k6-account.js— load/api/account(me, balance).load-test/k6-transfer.js— load/api/transfer.
Chạy (sau khi đã cài monitoring + KEDA, ScaledObjects đã apply):
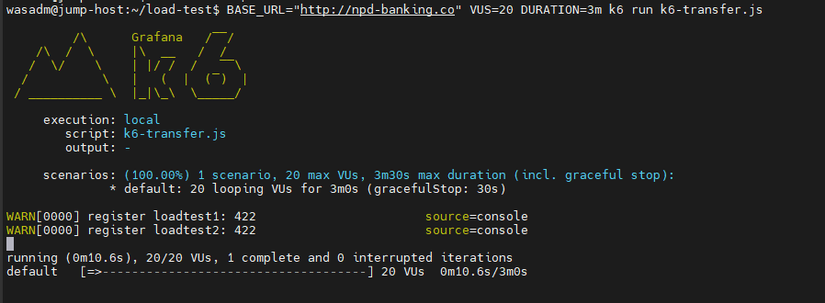
cd phase3-monitoring-keda/load-test
./run-scenarios.sh
Trong lúc chạy: kubectl get pods -n banking -w và kubectl get hpa -n banking — replicas tăng khi RPS vượt threshold. Dừng k6, đợi vài phút — replicas giảm dần. Chi tiết biến môi trường (BASE_URL, VUs, duration) xem load-test/README.md.
Kiểm chứng
| Bước | Kiểm tra |
|---|---|
| Trước load test | kubectl get pods -n banking — mỗi deployment 1 replica. |
| Trong load test | kubectl get pods -n banking, kubectl get hpa -n banking — replicas tăng (tới max). |
| Sau khi dừng k6 | Đợi cooldown — replicas giảm về min. |
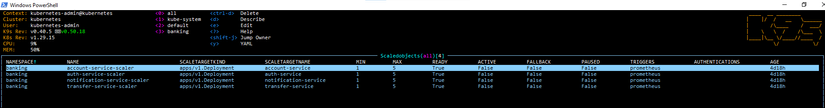
| ScaledObject | kubectl get scaledobject -n banking, kubectl describe scaledobject <name> -n banking. |
Tóm tắt
- Phase 3 thêm monitoring (Prometheus, Grafana, Loki, Promtail, Tempo, OTEL Collector) và auto scale (KEDA).
- Monitoring cài bằng Helm vào namespace
monitoring; scrape banking services, Kong, exporters; Grafana query Prometheus, Loki, Tempo. - KEDA scale 4 Deployment (auth, account, transfer, notification) theo Prometheus (rate
http_requests_total); cấu hình qua ScaledObject (threshold, min/max replicas, cooldown). - Load test (k6) dùng để kiểm chứng: RPS tăng → scale up; dừng tải → scale down.
Bài tiếp theo sẽ đi vào CI/CD (Phase 4): GitHub Actions build image, push registry, cập nhật Helm values và ArgoCD sync.
Bài tiếp theo
Bài 7: CI/CD — Build image và cập nhật deploy
- Pipeline build từng service, push image lên registry
- Cập nhật image tag trong values, ArgoCD sync
- Tích hợp với GitOps (Phase 4)
Tags: #monitoring #prometheus #grafana #keda #autoscale #kubernetes #devops #phase3
All rights reserved
