Vẽ biểu đồ lịch sử giá USDT/VND trên Binance với Prometheus Exporter và Grafana
Bối cảnh
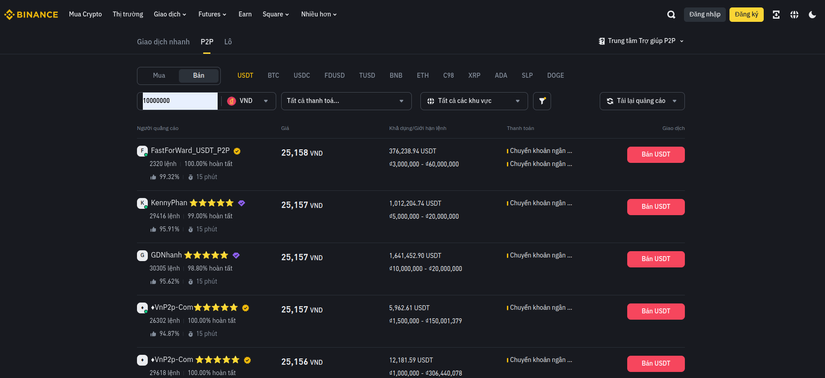
Dạo gần đây mình có quan tâm đến đồng USDT trên binance nên muốn theo dõi lịch sử giá của đồng này khi quy đổi ra VNĐ. Lượn một vòng trên các trang web thì không thấy có bất cứ một trang nào cung cấp được thông tin đảm bảo như mình mong muốn:
- Theo dõi tỉ giá bán với mức giao dịch từ 10.000.000 VNĐ
- Loại bỏ giá quảng cáo nằm ở đầu tiên (Giá này được lệch khá nhiều so với giá thị trường)
Trong bối cảnh vậy mình nghĩ thôi tự build luôn cho khỏe. Trong bài này mình sẽ chia sẻ lại quá trình build "vội" ra một hệ thống để lưu trữ và theo dõi lịch sử tỉ giá cặp USDT/VND.
Để build ra một hệ thống có thể vẽ được biểu đồ giá mình sử dụng 3 thành phần:
- Scraper (Python): Với mục đích cào dữ liệu trực tiếp từ trang Binance
- Prometheus: Dùng để lưu trữ lại dữ liệu lịch sử tỉ giá lâu dài.
- Grafana: Công cụ quen thuộc đi với Prometheus để Visualize thành biểu đồ.
Scraper (Python)
Bắt đầu với việc cào dữ liệu từ trang P2P Binance để lấy tỉ giá về. Mình lựa chọn lấy 3 giá gần nhất và tính trung bình để giảm thiểu độ chênh lệch với thực tế. Đoạn code sau sẽ chạy 1 thread và cào về giá mới mỗi 10 phút. Mình chọn 10 phút bởi vì nếu cào nhiều hơn sẽ dễ bị block  ))
))
Dữ liệu sẽ được trả ra dạng JSON ở path /
from flask import Flask, jsonify
import requests
import json
import threading
import time

app = Flask(__name__)

# Initialize variables
usdtvnd = 0

def update_usdt_vnd():
    global usdtvnd  # Access the global variable

    headers = {
        'Accept': '*/*',
        'Accept-Language': 'vi,vi-VN;q=0.9,en;q=0.8',
        'C2CType': 'c2c_web',
        'ClientType': 'web',
        'Content-Type': 'application/json',
        'Lang': 'vi',
        'Origin': 'https://p2p.binance.com',
        'Referer': 'https://p2p.binance.com/trade/sell/USDT?fiat=VND&payment=all-payments',
        'User-Agent': 'Mozilla/5.0 (X11; Linux x86_64) AppleWebKit/537.36 (KHTML, like Gecko) Chrome/123.0.0.0 Safari/537.36',
        'X-Passthrough-Token': ''  # Replace with your actual token if needed
    }

    data = {
        "fiat": "VND",
        "page": 1,
        "rows": 3,
        "tradeType": "SELL",
        "asset": "USDT",
        "countries": ["VN"],
        "proMerchantAds": False,
        "shieldMerchantAds": False,
        "filterType": "all",
        "additionalKycVerifyFilter": 0,
        "publisherType": None,
        "payTypes": [],
        "classifies": ["mass", "profession"],
        "transAmount": 10000000
    }

    url = 'https://p2p.binance.com/bapi/c2c/v2/friendly/c2c/adv/search'

    try:
        response = requests.post(url, headers=headers, json=data)
        response.raise_for_status()

        # Parse JSON data
        data = json.loads(response.text)

        # Extract prices and calculate average
        prices = []
        for item in data["data"]:
            price = float(item["adv"]["price"])
            prices.append(price)

        usdtvnd = round(sum(prices) / len(prices), 0)

    except requests.exceptions.RequestException as e:
        print(f"Error fetching data: {e}")

    # Schedule next update after 10 minutes
    threading.Timer(600, update_usdt_vnd).start()

# Start background thread to update price every 10 minutes
update_usdt_vnd()

@app.route('/')
def get_average_price():
    return jsonify({'USDT/VND': int(usdtvnd)})

if __name__ == '__main__':
    app.run(host='0.0.0.0', debug=True)
Khi truy cập vào địa chỉ ở port 5000 bạn sẽ nhận được giá trị dạng {'USDT/VND': 25100}. Như vậy ta đã lấy được giá trị đồng USDT ở thời điểm hiện tại.
Tiếp theo nhiệm vụ của ta là expose dữ liệu này ra dạng prometheus có thể đọc và lưu trữ được. Trong bài này mình sử dụng Python Exporter với thư viện prometheus_cilent Đoạn code sau khi thêm logic expose metrics cho prometheus sẽ như sau:
from flask import Flask, jsonify
import requests
import json
import threading
import time
from prometheus_client import start_http_server, Gauge, generate_latest

app = Flask(__name__)

# Initialize variables
usdtvnd = 0

# Prometheus metrics
usdt_vnd_gauge = Gauge('usdt_vnd', 'USDT to VND exchange rate') # Declare metric

def update_usdt_vnd():
    global usdtvnd  # Access the global variable

    headers = {
        'Accept': '*/*',
        'Accept-Language': 'vi,vi-VN;q=0.9,en;q=0.8',
        'C2CType': 'c2c_web',
        'ClientType': 'web',
        'Content-Type': 'application/json',
        'Lang': 'vi',
        'Origin': 'https://p2p.binance.com',
        'Referer': 'https://p2p.binance.com/trade/sell/USDT?fiat=VND&payment=all-payments',
        'User-Agent': 'Mozilla/5.0 (X11; Linux x86_64) AppleWebKit/537.36 (KHTML, like Gecko) Chrome/123.0.0.0 Safari/537.36',
        'X-Passthrough-Token': ''  # Replace with your actual token if needed
    }

    data = {
        "fiat": "VND",
        "page": 1,
        "rows": 3,
        "tradeType": "SELL",
        "asset": "USDT",
        "countries": ["VN"],
        "proMerchantAds": False,
        "shieldMerchantAds": False,
        "filterType": "all",
        "additionalKycVerifyFilter": 0,
        "publisherType": None,
        "payTypes": [],
        "classifies": ["mass", "profession"],
        "transAmount": 10000000
    }

    url = 'https://p2p.binance.com/bapi/c2c/v2/friendly/c2c/adv/search'

    try:
        response = requests.post(url, headers=headers, json=data)
        response.raise_for_status()

        # Parse JSON data
        data = json.loads(response.text)

        # Extract prices and calculate average
        prices = []
        for item in data["data"]:
            price = float(item["adv"]["price"])
            prices.append(price)

        usdtvnd = round(sum(prices) / len(prices), 0)

        # Update Prometheus metrics
        usdt_vnd_gauge.set(usdtvnd) # Update value for usdt_vnd metric

    except requests.exceptions.RequestException as e:
        print(f"Error fetching data: {e}")

    # Schedule next update after 10 minutes
    threading.Timer(600, update_usdt_vnd).start()

# Start background thread to update price every 10 minutes
update_usdt_vnd()

@app.route('/')
def get_average_price():
    return jsonify({'USDT/VND': int(usdtvnd)})

@app.route('/metrics')
def metrics():
    # Return the metrics for Prometheus
    return generate_latest(), 200, {'Content-Type': 'text/plain; charset=utf-8'}

if __name__ == '__main__':
    app.run(host='0.0.0.0', debug=True)
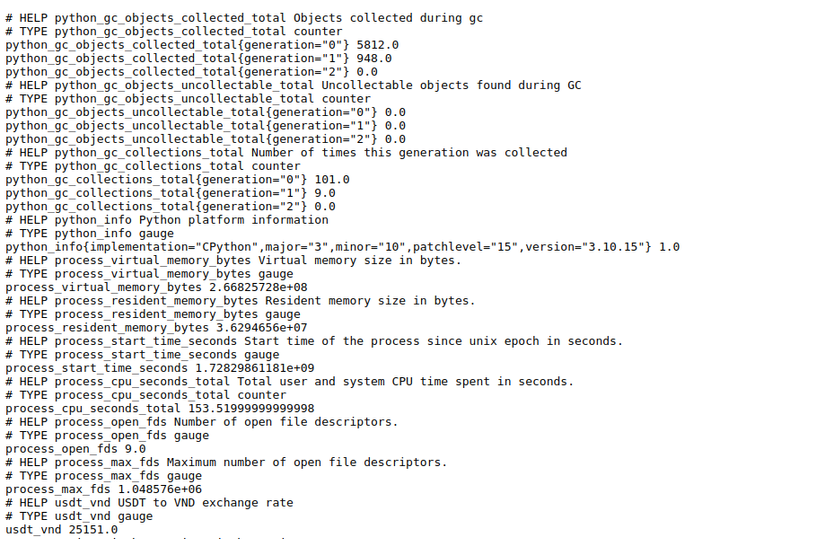
Chạy lại đoạn code trên và truy cập vào http://localhost:5000/metrics bạn sẽ thấy dữ liệu metrics cho prometheus đã được hiển thị như hình. Dưới cùng là metrics có tên usdt_vnd mà chúng ta đã định nghĩa kèm giá trị tại thời điểm hiện tại.
Như vậy ta đã làm xong phần đầu tiên và cũng là phần mệt nhất. Tiếp theo ta sẽ dựng prometheus và Grafana để lưu trữ dữ liệu.
Prometheus
Với Prometheus mình lựa chọn chạy container luôn cho tiện. Trước hết ta tạo file cấu hình cho Prometheus để truyền vào trong container. Tạo file prometheus.yml với nội dung như sau:
global:
  scrape_interval: 300s  # How frequently Prometheus will scrape targets
  evaluation_interval: 300s  # How frequently rules will be evaluated

scrape_configs:
  - job_name: 'usdt-metrics'  # Name of the job
    static_configs:
      - targets: ['172.16.1.16:5000']  # Thay đổi lại cho phù hợp với địa chỉ service Python đang chạy
Sau đó chạy Prometheus container lên với command như sau:
docker run -d --name prometheus -p 9090:9090 -v ./prometheus.yml:/etc/prometheus/prometheus.yml prom/prometheus
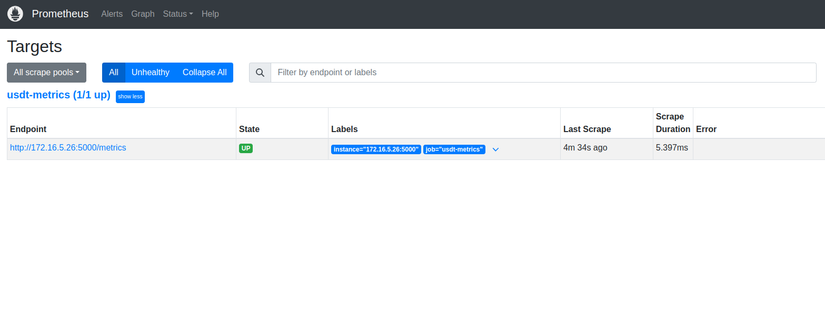
Truy cập vào prometheus ở địa chỉ localhost:9090 truy cập Status => Targets thấy có Endpoint với tình trạng UP như hình là ngon rồi
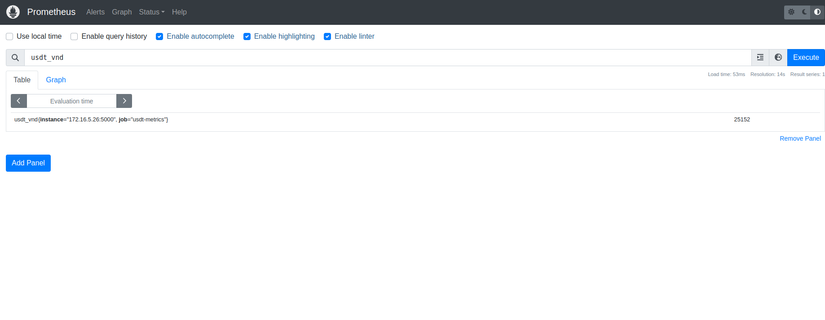
Chắc cốp hơn nữa thì bạn có thể truy cập vào Graph để query thử metrics. Lưu ý thời gian mình đang để 5 phút nên có thể bạn sẽ phải đợi 1 lúc để Prometheus cào dữ liệu đầu tiên về.
Grafana
Cuối cùng thì bạn có thể cài đặt Grafana để visualize dữ liệu đã thu thập về Prometheus. Chạy Grafana container lên với cấu hình như sau:
docker run -d --name grafana -p 3000:3000 grafana/grafana
Truy cập vào Grafana và cấu hình Data Source để hiển thị thông qua mục Connection => Data Sources => Add new datasource
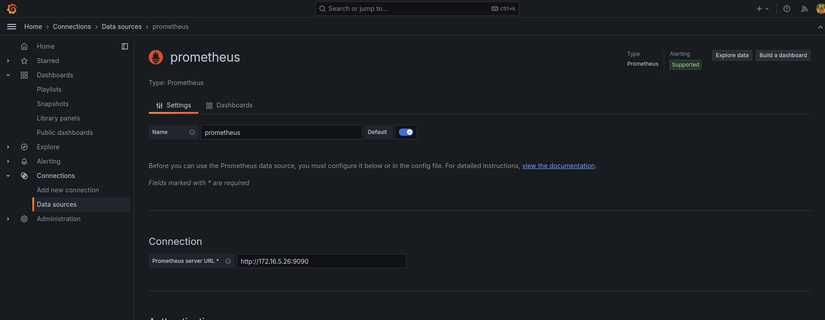
Sau khi Save & Test data source thành công cho Prometheus ta có thể bắt đầu vẽ biểu đồ cho metric này.
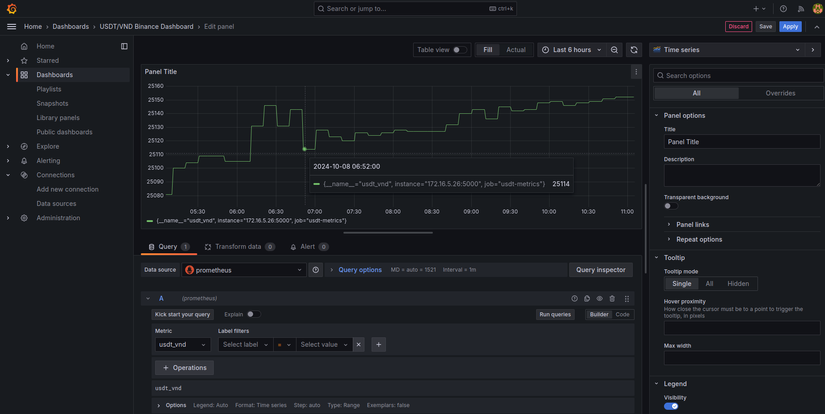
Truy cập vào Dashboard section và tạo thử 1 dashboard với metric có tên usdt_vnd
Kết
Bằng cách sử dụng Prometheus Exporter, chúng ta có thể theo dõi bất cứ dữ liệu nào mà chúng ta mong muốn. Bài viết là quá trình mình xây dựng hệ thống theo dõi tỉ giá USDT/VND. Hy vọng bài viết sẽ giúp bạn có thêm 1 giải pháp mới trong công việc.
Nếu thấy bài viết hay thì đừng ngại cho mình 1 Upvote và Follow để theo dõi thêm các bài khác nữa nhé! Have a nice day!
Chuyên mục quảng cáo
Nếu như bạn đang gặp khúc mắc trong vấn đề chuyên môn hay cần người hỗ trợ về mặt hệ thống, DevOps tools thì mình tự tin có thể hỗ trợ được bạn. Liên hệ với mình để trao đổi thêm nhé https://hoangviet.io.vn/
All rights reserved
