Triển khai EFK Stack trên Kubernetes
Bài đăng này đã không được cập nhật trong 4 năm
EFK stack on K8S
Link bài vết gốc trên blog của mình https://ductn.info/EFK-stack-on-Kubernetes
Giới thiệu
Một hệ thống có thể chạy nhiều dịch vụ hoặc ứng dụng khác nhau, vì vậy việc theo dõi hệ thống là vô cùng cần thiết. Logging là một công cụ đơn giản nhưng lại rất tiện lợi giúp ghi lại toàn bộ hoạt động của hệ thống. Nhờ có logging, ta có thể tra cứu lại trạng thái của hệ thống trong quá khứ và có thể tìm và fix lại lỗi dễ dàng hơn.
Hiện nay đã có khá nhiều công cụ để quản lý log khác nhau. Trong bài viết này, mình sẽ đề cập đến bộ công cụ EFK(Elasticsearch-Fluentbit-Kibana). EFK có rất nhiều ưu điểm như phần mềm mã nguồn mở hoàn toàn miễn phí 😁😁😁 và rất dễ xài nữa. Bây giờ, mình sẽ giới thiệu cho anh em bộ công cụ này và mình dùng để demo theo dõi log của cụm kubernetes. OK!!! Vào thôi.
EFK stack là tập hợp của 3 phần mềm đi chung với nhau bao gồm:
- Elasticsearch: Cơ sở dữ liệu NoSQL dùng để lưu trữ dữ liệu và cung cấp interface để tìm kiếm và query log.
- Fluent-bit: Là phần mềm mã nguồn mở, viết bằng C, được thiết kế nhằm chú trọng đến hiệu suất. Nó cho phép bạn thu thập logs từ nhiều nguồn khác nhau. Fluent bit được phát triển bởi Fluentd team với mục đích tạo ra một phiên bản lightweight trong việc xử lý logs. Sau đó, fluent bit được sử dụng như một giải pháp xử lý dành cho Cloud.
- Kibana: Giao diện để quản lý, thống kê logs. Có nhiệm vụ đọc thông tin từ elasticsearch.
Cơ chế hoạt động của bộ công cụ được mô tả qua hình dưới đây:
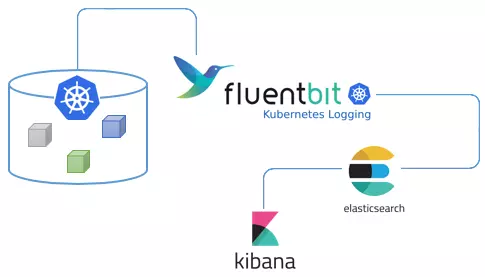
- Đầu tiên, log sẽ được đưa đến Fluent-bit.
- Fluent-bit sẽ đọc những log này, thêm những thông tin như thời gian, IP, parse dữ liệu từ log (server nào, độ nghiêm trọng, nội dung log) và ghi xuống Elasticsearch.
- Để xem log, chúng ta truy cập URL của Kibana. Kibana sẽ đọc thông tin log trong Elasticsearch, hiển thị lên giao diện cho người dùng query và xử lý.
Bây giờ, mình sẽ "đề mô" EFK stack cho Kubernetes
Demo
Ở bài viết này, mình sử dụng minikube để deploy cụm kubernetes, vì vậy anh em nào chưa cài minikube thì cài nha 😁😁😁. Để cài thì anh em cứ vô trang chủ xem thôi, cũng đơn giản thôi. Anh em sẽ phải cài hai thứ là minikube và set up kubectl cho minikube, mình để link cài ở đây cho ai lười tìm :v.
Mình sẽ demo theo thứ tự sau Elasticsearch - Kibana - Fluent bit. Source code mình sẽ để ở đây cho anh em tiện theo dõi.
Bước 1: Start cụm minikube
ductn@ductn:~/demo-EFK$ minikube start
😄  minikube v1.17.1 on Ubuntu 18.04
🎉  minikube 1.18.1 is available! Download it: https://github.com/kubernetes/minikube/releases/tag/v1.18.1
💡  To disable this notice, run: 'minikube config set WantUpdateNotification false'
✨  Automatically selected the docker driver
👍  Starting control plane node minikube in cluster minikube
🔥  Creating docker container (CPUs=2, Memory=2200MB) ...
🐳  Preparing Kubernetes v1.20.2 on Docker 20.10.2 ...
    ▪ Generating certificates and keys ...
    ▪ Booting up control plane ...
    ▪ Configuring RBAC rules ...
🔎  Verifying Kubernetes components...
🌟  Enabled addons: storage-provisioner, default-storageclass
🏄  Done! kubectl is now configured to use "minikube" cluster and "default" namespace by default
Bước 2: Tạo namespace chung cho cụm kubernetes
ductn@ductn:~/demo-EFK$ kubectl create -f https://raw.githubusercontent.com/ductnn/EFK-Stack-boilerplate/main/common/kube-logging.yaml
namespace/kube-logging created
Kiểm tra
ductn@ductn:~/demo-EFK$ kubectl get ns
NAME              STATUS   AGE
default           Active   2m24s
kube-logging      Active   15s
kube-node-lease   Active   2m25s
kube-public       Active   2m25s
kube-system       Active   2m25s
Ta thấy namespace kube-logging chung đã được tạo
Bước 3: Deploy Elasticsearch. Ở bước này chung ta sẽ deploy 2 phần, đầu
tiên là service và statefuleset của elasticsearch. Ở trong serivices
mình sử dụng type: NodePort để dễ dàng chọc vô kiểm tra, nhưng cách này
chỉ phục vụ demo cho dễ thôi chứ không an toàn vì ai lại đi choc vô DB tùy tiện
nhỷ 😸💀👻.
ductn@ductn:~/demo-EFK$ kubectl create -f https://raw.githubusercontent.com/ductnn/EFK-Stack-boilerplate/main/elastic-search/elastic-service.yaml
service/elasticsearch created
ductn@ductn:~/demo-EFK$ kubectl create -f https://raw.githubusercontent.com/ductnn/EFK-Stack-boilerplate/main/elastic-search/elastic-statefulset.yaml
statefulset.apps/elasticsearch created
Kiểm tra
ductn@ductn:~/demo-EFK$ kubectl get svc -n kube-logging
NAME            TYPE       CLUSTER-IP       EXTERNAL-IP   PORT(S)          AGE
elasticsearch   NodePort   10.101.126.180   <none>        9200:31544/TCP   54s
ductn@ductn:~/demo-EFK$ kubectl get pods -n kube-logging
NAME              READY   STATUS    RESTARTS   AGE
elasticsearch-0   1/1     Running   0          84s
Bước 4: Deploy Kibana, mình cũng sẽ deploy giống thằng elasticsearch,
services vẫn sẽ để type: NodePort để tiện demo.
ductn@ductn:~/demo-EFK$ kubectl create -f https://raw.githubusercontent.com/ductnn/EFK-Stack-boilerplate/main/kibana/kibana.yml
service/kibana created
deployment.apps/kibana created
Kiểm tra
ductn@ductn:~/demo-EFK$ kubectl get svc -n kube-logging
NAME            TYPE       CLUSTER-IP       EXTERNAL-IP   PORT(S)          AGE
elasticsearch   NodePort   10.101.126.180   <none>        9200:31544/TCP   6m56s
kibana          NodePort   10.103.245.24    <none>        5601:31122/TCP   37s
ductn@ductn:~/demo-EFK$ kubectl get pods -n kube-logging
NAME                      READY   STATUS    RESTARTS   AGE
elasticsearch-0           1/1     Running   0          7m16s
kibana-5d6849dc8c-kmf7l   1/1     Running   0          82s
Sau đây là phần quan trọng nhất, deploy bé Fluent-bit. Mình sẽ giải thích kỹ qua các bước deploy.
Đầu tiên, để thu thập logs từ cụm kubernetes, mình sẽ phải cấp cho fluent-bit
một account và một số quyền như ["get", "list", "watch"] để có thể quản lý
logs.
ductn@ductn:~/demo-EFK$ kubectl create -f https://raw.githubusercontent.com/ductnn/EFK-Stack-boilerplate/main/fluent-bit/fluent-bit-service-account.yml
serviceaccount/fluent-bit created
ductn@ductn:~/demo-EFK$ kubectl create -f https://raw.githubusercontent.com/ductnn/EFK-Stack-boilerplate/main/fluent-bit/fluent-bit-role.yml
Warning: rbac.authorization.k8s.io/v1beta1 ClusterRole is deprecated in v1.17+, unavailable in v1.22+; use rbac.authorization.k8s.io/v1 ClusterRole
clusterrole.rbac.authorization.k8s.io/fluent-bit-read created
OK!!! Sau đó, ta cần liên kết ServiceAccount với ClusterRole vừa tạo ở trên
ductn@ductn:~/demo-EFK$ kubectl create -f https://raw.githubusercontent.com/ductnn/EFK-Stack-boilerplate/main/fluent-bit/fluent-bit-role-binding.yml
Warning: rbac.authorization.k8s.io/v1beta1 ClusterRoleBinding is deprecated in v1.17+, unavailable in v1.22+; use rbac.authorization.k8s.io/v1 ClusterRoleBinding
clusterrolebinding.rbac.authorization.k8s.io/fluent-bit-read created
Tiếp theo, mình tiến hành deploy file ConfigMap của fluent-bit. Anh em có thể
theo dõi file ConfigMap của mình ở đây.
Ở đây, mình sử dụng 4 sections của fluent-bit:
- [SERVICE] dùng để tạo file logs.
- [INPUT] cấu hình đầu vào của nơi lấy logs. Phần lấy logs mình lấy tại thư mục
/var/log/containers/*.logtrong cụm minikube. Anh em có thể cấu hình file log mà mình muốn lấy (Ví dụ: etcd, kube-api, ...). - [OUTPUT] cấu hình đầu ra file log là
hostvàportcủa elasticsearch. - [PARSER] cấu hình file logs dạng
jsonvà time,...
Anh em có thể tìm hiểu thêm trên docs của fluent-bit nhá. Mình cấu hình sương sương vậy, demo tiếp thôi :3
ductn@ductn:~/demo-EFK$ kubectl create -f https://raw.githubusercontent.com/ductnn/EFK-Stack-boilerplate/main/fluent-bit/fluent-bit-configmap.yml
configmap/fluent-bit-config created
Cuối cùng là deploy file DaemonSet của fluent-bit. Nhưng trước đó, anh em quay
lại chỗ của elasticsearch để lấy IP và cấu hình vào file DaemonSet của
fluent-bit như sau:
Lấy IP của elasticsearch
ductn@ductn:~/demo-EFK$ kubectl get svc -n kube-logging
NAME            TYPE       CLUSTER-IP       EXTERNAL-IP   PORT(S)          AGE
elasticsearch   NodePort   10.101.126.180   <none>        9200:31544/TCP   50m
Cấu hình vào fluent-bit:
env:
- name: FLUENT_ELASTICSEARCH_HOST
    value: "10.101.126.180"
OK!!! Xong xuôi rôi deploy thôi :3
ductn@ductn:~/demo-EFK$ kubectl create -f fluent-bit-ds-minikube.yml
daemonset.apps/fluent-bit created
Kiểm tra
ductn@ductn:~/demo-EFK$ kubectl get pods -n kube-logging
NAME                      READY   STATUS    RESTARTS   AGE
elasticsearch-0           1/1     Running   0          53m
fluent-bit-fv4pm          1/1     Running   0          31s
kibana-5d6849dc8c-kmf7l   1/1     Running   0          47m
Done!!! Kiểm tra thành quả nào. Anh em check ip của cụm minikube theo command
minikube ip sau đó check port của kibana qua command:
ductn@ductn:~/demo-EFK$ kubectl get svc -n kube-logging
NAME            TYPE       CLUSTER-IP       EXTERNAL-IP   PORT(S)          AGE
elasticsearch   NodePort   10.101.126.180   <none>        9200:31544/TCP   53m
kibana          NodePort   10.103.245.24    <none>        5601:31122/TCP   47m
Sau đó, mở trình duyệt truy cập địa chỉ $(minikube ip):31122 để xem kết quả
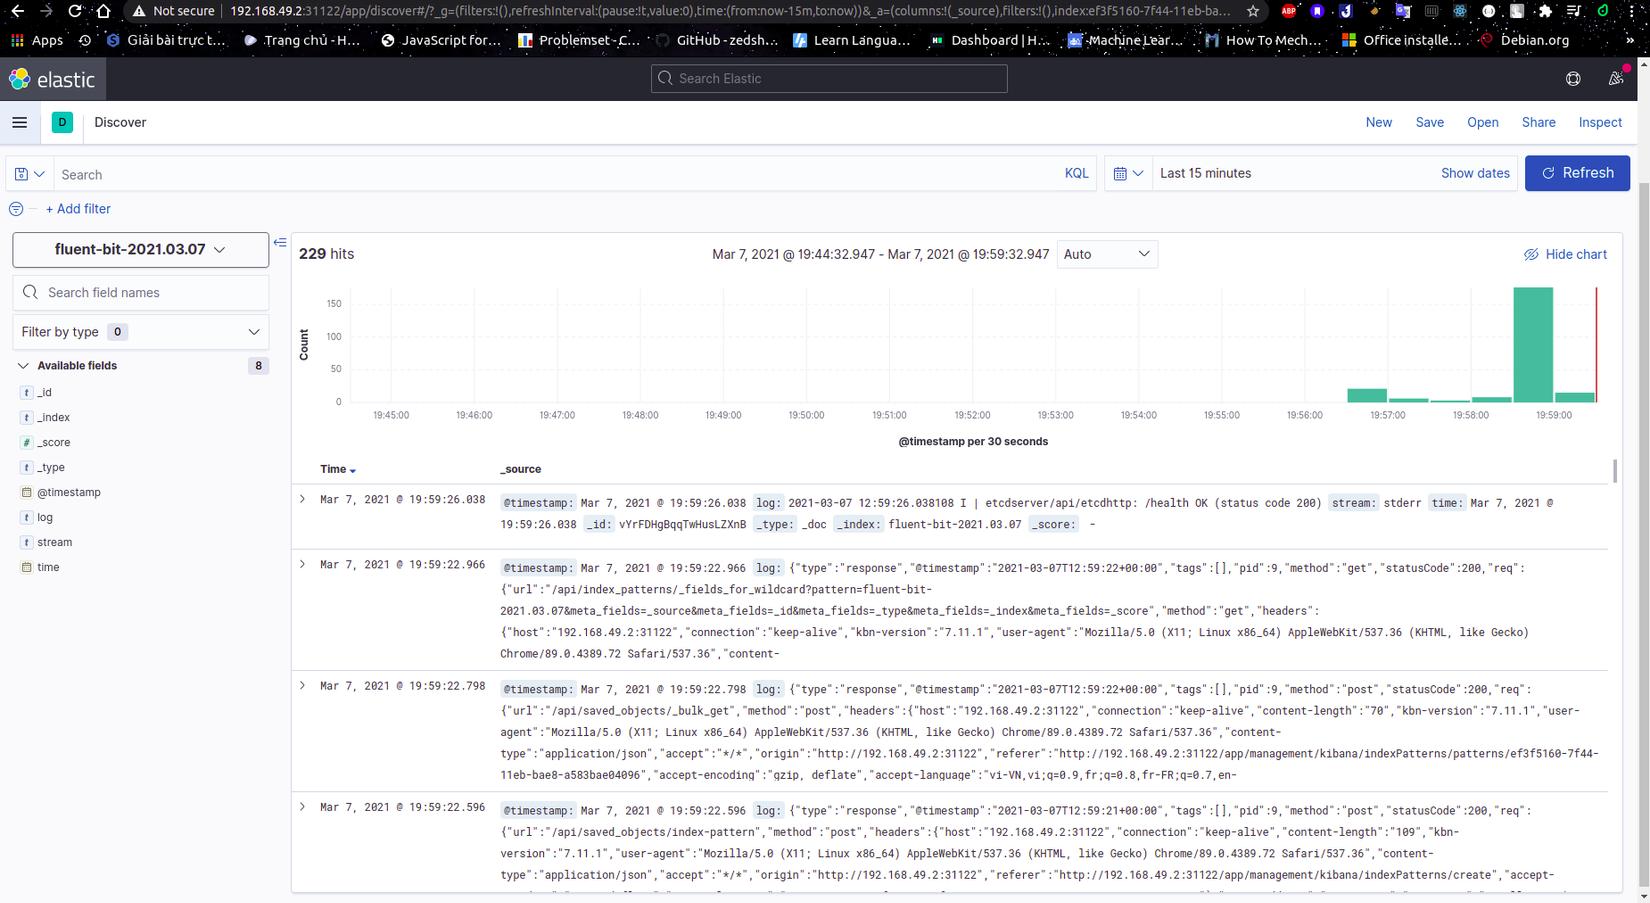
Vậy là mình là vừa demo xong EFK stack để theo dõi logs của cụm kubernetes.
Hy vọng, bài viết này của mình sẽ giúp anh hiểu được phần nào của cách hoạt động và lợi ích của EFK 🎉🎉🎉. Cảm ơn anh em đã đọc 😄😄😄.
References
All rights reserved
