Tracing your apps with OpenTracing API
Bài đăng này đã không được cập nhật trong 4 năm
One of the most important things to monitor on any application is the timeline. Without it it is impossible to detect which parts might cause delays and which services or libraries require performance improvements. And most troubles start to appear with micro-service architectures — when your application grows to numerous separated services, it might be very hard to collect all performance data in one place.
In late 2015 OpenTracing API specification was developed to help with such issues.
The concept of OpenTracing is to create a common vendor-neutral standard for tracing application execution and connections.
Basics
In order to implement your tracing system, you need to choose one of available tracers and set up instrumentation on your services.
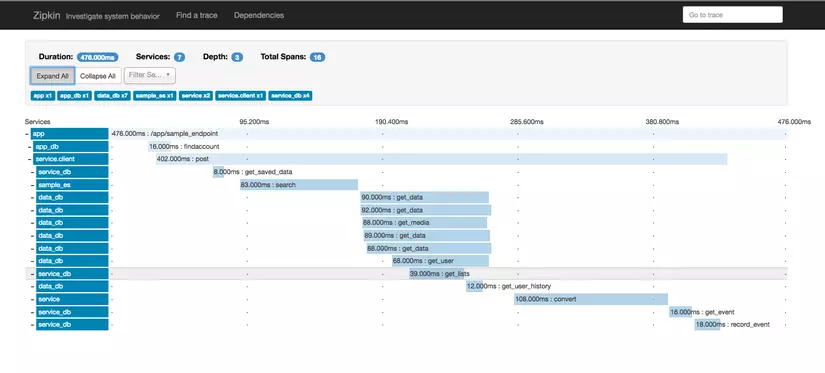
I am going to describe the process on the example of Zipkin as a tracer, Node.js frontend application and PHP backend with connections to Redis and abstract database.
Setup Zipkin
The best way is to use Zipkin docker image. It is very simple to run
docker run -d -p 9411:9411 openzipkin/zipkin
The application itself is now available at http://localhost:9411 and API endpoint is http://localhost:9411/api. It includes basic UI to view your traces.
There is also advanced experimental UI available at Github repository
By default, Zipkin uses temporary storage, which will be emptied when you turn off the server. In order to save the data permanently you need to set up one of available storages (MySQL, Cassandra and ElasticSearch are supported).
Check out Docker Zipkin repository for advanced configurations.
Tracing concept
Tracing includes 2 basic terms: a trace and a span.
Trace is the begin-to-end operation, which involves all the application workflow. Span is a single operation which you need to measure.
Spans may have parent-child or following relationships.
Causal relationships between Spans in a single Trace


        [Span A]  ←←←(the root span)
            |
     +------+------+
     |             |
 [Span B]      [Span C] ←←←(Span C is a `ChildOf` Span A)
     |             |
 [Span D]      +---+-------+
               |           |
           [Span E]    [Span F] >>> [Span G] >>> [Span H]
                                       ↑
                                       ↑
                                       ↑
                         (Span G `FollowsFrom` Span F)
Temporal relationships between Spans in a single Trace


––|–––––––|–––––––|–––––––|–––––––|–––––––|–––––––|–––––––|–> time

 [Span A···················································]
   [Span B··············································]
      [Span D··········································]
    [Span C········································]
         [Span E·······]        [Span F··] [Span G··] [Span H··]
Every trace includes Endpoint information, which, in general, consists of service name, IP address and port.
Zipkin accepts trace and span information at any time — you don't need to pass related data in one request.
Every trace has an unique 16-char or 32-char ID. All spans within the trace MUST include the same trace ID. Your services may be trace ID providing (clients), consuming (servers) or both. Providing service generates the ID and sends it with HTTP header to all connected services. Consuming services parse HTTP headers and include existing trace ID into requests to Zipkin.
Every span MUST include it's name (e. g. GET /login), endpoint information and start/end timestamps. Zipkin uses microseconds, so great precision can be achieved.
Usage in your Node.js code
There are 2 popular instrumentations available for Node applications:
Both support Zipkin as a tracer and we are going to use Zipkin JS.
Add the library to your dependencies
$ npm install --save zipkin-js
Instantiate tracer and recorder instances
const { BatchRecorder } = require('zipkin')
const { HttpLogger } = require('zipkin-transport-http')

// Send spans to Zipkin asynchronously over HTTP
const zipkinBaseUrl = 'http://localhost:9411'
const recorder = new BatchRecorder({
  logger: new HttpLogger({
    endpoint: `${zipkinBaseUrl}/api/v1/spans`
  })
});

module.exports = recorder;
// tracer.js
const CLSContext = require('zipkin-context-cls')
const { Tracer, Annotation, InetAddress, Request } = require('zipkin')

const recorder = require('./recorder')

const ctxImpl = new CLSContext('zipkin')
const tracer = new Tracer({ ctxImpl, recorder })

module.exports = tracer
Making client requests to other servers
Now the tracer is ready for use. The tracer has quite simple API, which allows to wrap any executed code into a span.
// app.js
const axios = require('axios')
const tracer = require('./tracer')
const { Annotation, InetAddress, Request } = require('zipkin')

const serviceName = 'server1'
const host = new InetAddress('127.0.0.1')
const port = 4001

// ... Further in your code

tracer.letChildId((traceId) => {
    // Now this code will be executed inside child-span scope.
    // Every span requires special annotations to store

    // First write client information (our current service)
    tracer.recordServiceName(serviceName)
    tracer.recordAnnotation(new Annotation.LocalAddr({
        host,
        port,
    }))

    // Annotation.ServerAddr stores information about the service we are requesting
    // This might be HTTP, Redis, SQL or any other server you are connecting to
    tracer.recordAnnotation(new Annotation.ServerAddr({
        serviceName: 'server2',
        host: new InetAddress('127.0.0.1'),
        port: 4002,
    }))

    // Rpc data stores operation name
    // For HTTP requests might be just method or readable operation name (e. g. get_posts)
    tracer.recordRpc('get')

    // Binary data may include any additional request information
    tracer.recordBinary('http.url', 'http://localhost:4002')

    // Inform tracer that current app is a client
    tracer.recordAnnotation(new Annotation.ClientSend());

    // Add trace header for server-side app to consume trace data
    const zipkinOpts = Request.addZipkinHeaders({}, traceId);

    axios.get('http://localhost:4002', zipkinOpts).then((response) => {
        tracer.scoped(() => {
            // After promise has been resolved, write response data to tracer
            // with the ID we received before
            tracer.setId(traceId);
            tracer.recordBinary('http.status_code', response.status.toString());

            // Inform tracer that we have received request as a client
            tracer.recordAnnotation(new Annotation.ClientRecv());
        });
        resolve(response.data)
    })
});
Of course, you can simplify the code by making wrapper functions to any code executed.
Storing server-side spans
If your current service acts as a server (or both server and client), you may need to store server-side span info. This will help you to trace connection delays. If the span has been sent from both client and server, you will see it in a tree view.
[-] serverA                     [100.000 ms: get_posts========================]
    [-] serverB                       [90.000 ms: get_posts===============]
                                ^- request started                            ^- response received
                                      ^- request received                 ^- response sent
In previous example we provided special Zipkin headers into request. On our server app we can parse them:
X-B3-TraceId: Main trace ID
X-B3-SpanId: Current operation span ID
X-B3-ParentSpanId: Parent span ID if present
Now you only need to enable middleware, which will pass data to recorder.
// app.js
const app = require('express')()
const tracer = require('./tracer')
const expressMiddleware = require('zipkin-instrumentation-express').expressMiddleware

const serviceName = 'server1'
const host = new InetAddress('127.0.0.1')
const port = 4001

app.use(expressMiddleware({
    tracer,
    serviceName,
    port,
}))

app.listen(port, host.addr)
That's all you need. Of course, you can take a look at middleware source code and other instrumentations for more details.
Usage in PHP code
There is not much difference with PHP. The most popular library is whitemerry/phpkin.
$ composer require whitemerry/phpkin
As PHP code is not async, you need to instantiate tracer instance as early as possible.
// app/tracer.php
$endpoint = new whitemerry\phpkin\Endpoint(
    'server2', // Application name
    '127.0.0.1', // Current application IP address
    '4002' // Current application port (default 80)
);

$logger = new whitemerry\phpkin\Logger\SimpleHttpLogger([
     'host' => 'http://localhost:9411' // Zipkin's API host with schema (http://) and without trailing slash
]);

$traceSpanId = null;
if (!empty($_SERVER['HTTP_X_B3_SPANID'])) {
    $traceSpanId = new whitemerry\phpkin\Identifier\SpanIdentifier($_SERVER['HTTP_X_B3_SPANID']);
}

$isSampled = null;
if (!empty($_SERVER['HTTP_X_B3_SAMPLED'])) {
    $isSampled = (bool) $_SERVER['HTTP_X_B3_SAMPLED'];
}

$tracer = new whitemerry\phpkin\Tracer(
    'GET',
    $endpoint,
    $logger,
    $isSampled,
    $traceId,
    $traceSpanId
);

$tracer->setProfile(whitemerry\phpkin\Tracer::BACKEND);

return $tracer;
In this code I use Silex as an example app.
// public/index.php
require __DIR__.'/../vendor/autoload.php';
$tracer = require(__DIR__.'../app/tracer.php';

$app = require __DIR__.'/../app/app.php';
$app['tracer'] = $tracer; // Put the tracer into DI container for later use.

$app->finish(function () use ($tracer) {
    // After request has been sent, we can store the data to Zipkin.
    $tracer->trace();
});

$app->run();
This is all you need for your service to work as a server app.
SimpleHttpLogger is using file_get_contents function, which might cause issues in your code. Here is a logger implementation using Guzzle:
In case you want to trace further requests to client services, use the tracer instance previously created.
// app/app.php

use Symfony\Component\HttpFoundation\JsonResponse;

$app = new Silex\Application();
$app['debug'] = true;

$app->get('/', function () use ($app) {
    $start = zipkin_timestamp();

    // DO SOME QUERY HERE

    $meta = new \whitemerry\phpkin\Metadata();

    $meta->set('some_key', 'some_value');

    $span = new \whitemerry\phpkin\Span(
        new \whitemerry\phpkin\Identifier\SpanIdentifier(),
        'connect',
        new \whitemerry\phpkin\AnnotationBlock(
            new \whitemerry\phpkin\Endpoint(
                'database',
                '127.0.0.1',
                5000
            ),
            $start,
            zipkin_timestamp(),
            \whitemerry\phpkin\AnnotationBlock::CLIENT
        ),
        null,
        \whitemerry\phpkin\TracerInfo::getTraceId()
    );

    $app['tracer']->addSpan($span);

    return new JsonResponse([
        'status' => 'ok',
    ]);
});

return $app;
Other instrumentations
Currently there is Zipkin or Opentracing instrumentation available for most popular languages.
Official Zipkin list includes Go, Java, JavaScript, Ruby and Scala, and numerous third-party libraries.
All rights reserved
