


Lab 6 - Xây dựng Dashboard với Grafana
Series: Kubernetes từ Zero đến Production
Tình huống thực tế
Sau Lab 5, DevOps đã triển khai thành công Prometheus.
Bây giờ có thể query Metrics:
up

node_cpu_seconds_total

node_memory_MemAvailable_bytes
Mặc dù đã có đầy đủ dữ liệu, nhưng việc đọc hàng nghìn Time Series trong Prometheus không hề dễ dàng.
Một Product Owner sẽ không muốn nhìn thấy:
container_cpu_usage_seconds_total

node_memory_MemAvailable_bytes

container_network_receive_bytes_total
Họ chỉ muốn biết:
- CPU đang bao nhiêu?
- Memory còn bao nhiêu?
- Pod nào Restart?
- Hệ thống có ổn định không?
DevOps cũng cần theo dõi toàn bộ Cluster chỉ bằng một màn hình.
Đó là lý do Grafana ra đời.
Mục tiêu
Sau bài lab này, bạn sẽ:
- Hiểu Grafana là gì
- Cài Grafana bằng Helm
- Kết nối Prometheus
- Import Dashboard Kubernetes
- Theo dõi CPU
- Theo dõi Memory
- Theo dõi Pod
- Theo dõi Node
- Hiểu Dashboard hoạt động như thế nào
Kiến thức cần chuẩn bị
Đã hoàn thành:
- ✅ Lab 1
- ✅ Lab 2
- ✅ Lab 3
- ✅ Lab 4
- ✅ Lab 5
Prometheus đang hoạt động bình thường.
Kiến trúc
Kubernetes Cluster
       ↓
    Metrics
       ↓
  Prometheus
       ↓
   Grafana
       ↓
   Dashboard
Prometheus lưu dữ liệu.
Grafana chỉ đọc dữ liệu từ Prometheus.
Grafana là gì?
Grafana là nền tảng trực quan hóa dữ liệu.
Grafana không thu thập Metrics.
Grafana chỉ:
- Đọc dữ liệu
- Hiển thị Dashboard
- Vẽ biểu đồ
- Thiết lập Alert (Lab sau)
Bước 1. Kiểm tra Prometheus
Đảm bảo Prometheus vẫn hoạt động.
kubectl get pods -n monitoring
Ví dụ:
NAME                                                 READY   STATUS    RESTARTS   AGE
prometheus-alertmanager-0                            1/1     Running   0          3h4m
prometheus-kube-state-metrics-76444ffd98-tbjq4       1/1     Running   0          3h4m
prometheus-prometheus-node-exporter-rs4hg            1/1     Running   0          3h4m
prometheus-prometheus-pushgateway-5df4b4d79b-tgzp9   1/1     Running   0          3h4m
prometheus-server-dc466d8cc-tx8wh                    2/2     Running   0          3h4m
Kiểm tra Service:
kubectl get svc -n monitoring
Ví dụ:
NAME                                  TYPE        CLUSTER-IP      EXTERNAL-IP   PORT(S)    AGE
prometheus-alertmanager               ClusterIP   10.99.184.223   <none>        9093/TCP   3h5m
prometheus-alertmanager-headless      ClusterIP   None            <none>        9093/TCP   3h5m
prometheus-kube-state-metrics         ClusterIP   10.96.21.129    <none>        8080/TCP   3h5m
prometheus-prometheus-node-exporter   ClusterIP   10.104.116.55   <none>        9100/TCP   3h5m
prometheus-prometheus-pushgateway     ClusterIP   10.108.131.6    <none>        9091/TCP   3h5m
prometheus-server                     ClusterIP   10.103.48.229   <none>        80/TCP     3h5m
Bước 2. Cài Grafana bằng Helm
Thêm Repository nếu chưa có:
helm repo add grafana https://grafana.github.io/helm-charts
Cập nhật:
helm repo update
Cài đặt:
helm install grafana \
grafana/grafana \
-n monitoring
Đợi khoảng vài phút.
Bước 3. Kiểm tra Grafana
kubectl get pods -n monitoring
Ví dụ:
NAME                                                 READY   STATUS              RESTARTS   AGE
grafana-799c9d794-2qfvt                              0/1     ContainerCreating   0          8s
prometheus-alertmanager-0                            1/1     Running             0          3h5m
prometheus-kube-state-metrics-76444ffd98-tbjq4       1/1     Running             0          3h5m
prometheus-prometheus-node-exporter-rs4hg            1/1     Running             0          3h5m
prometheus-prometheus-pushgateway-5df4b4d79b-tgzp9   1/1     Running             0          3h5m
prometheus-server-dc466d8cc-tx8wh                    2/2     Running             0          3h5m
Kiểm tra Service:
kubectl get svc -n monitoring
Ví dụ:
NAME                                  TYPE        CLUSTER-IP      EXTERNAL-IP   PORT(S)    AGE
grafana                               ClusterIP   10.110.17.23    <none>        80/TCP     26s
prometheus-alertmanager               ClusterIP   10.99.184.223   <none>        9093/TCP   3h6m
prometheus-alertmanager-headless      ClusterIP   None            <none>        9093/TCP   3h6m
prometheus-kube-state-metrics         ClusterIP   10.96.21.129    <none>        8080/TCP   3h6m
prometheus-prometheus-node-exporter   ClusterIP   10.104.116.55   <none>        9100/TCP   3h6m
prometheus-prometheus-pushgateway     ClusterIP   10.108.131.6    <none>        9091/TCP   3h6m
prometheus-server                     ClusterIP   10.103.48.229   <none>        80/TCP     3h6m
Bước 4. Lấy mật khẩu Admin
Grafana tạo password ngẫu nhiên.
Lấy password:
kubectl get secret grafana \
-n monitoring \
-o jsonpath="{.data.admin-password}" \
| base64 --decode
Username:
admin
Password:
********
Bước 5. Truy cập Grafana
Forward cổng:
kubectl port-forward svc/grafana 3000:80 -n monitoring
Mở trình duyệt:
http://localhost:3000
Đăng nhập bằng: Username admin và Password vừa lấy ở bước trước.
Bước 6. Kết nối Prometheus
Trong Grafana:
- Chọn
Add data source - Chọn
Prometheus
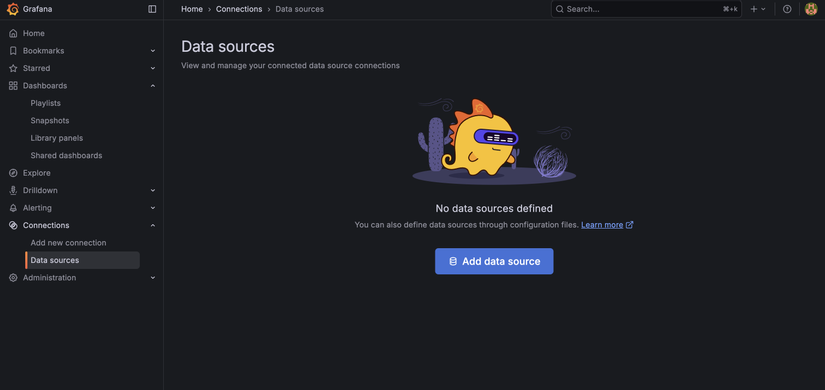
- Nhập
Prometheus server URL:http://prometheus-server.monitoring.svc.cluster.local - Nhấn:
Save & Test
Nếu thành công:
Successfully queried the Prometheus API.
Grafana đã kết nối được Prometheus.
Bước 7. Kiểm tra Explore
- Mở
Explore - Chạy query:
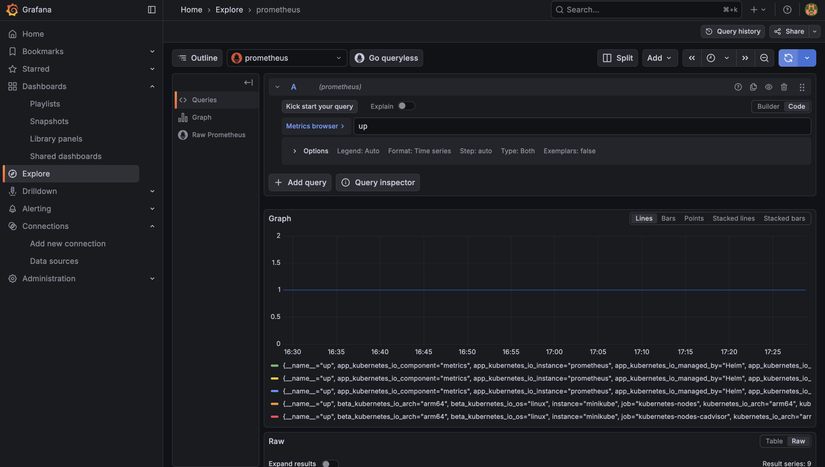
up
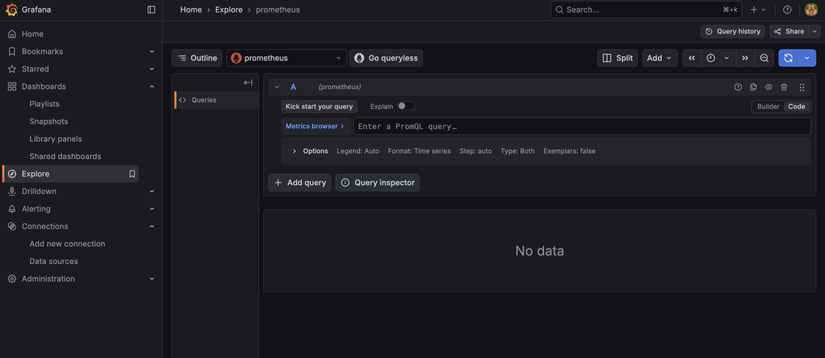
Kết quả như sau nghĩa là Grafana đang đọc được Metrics từ Prometheus.
Bước 8. Import Dashboard Kubernetes
- Mở
DashboardsđểImport
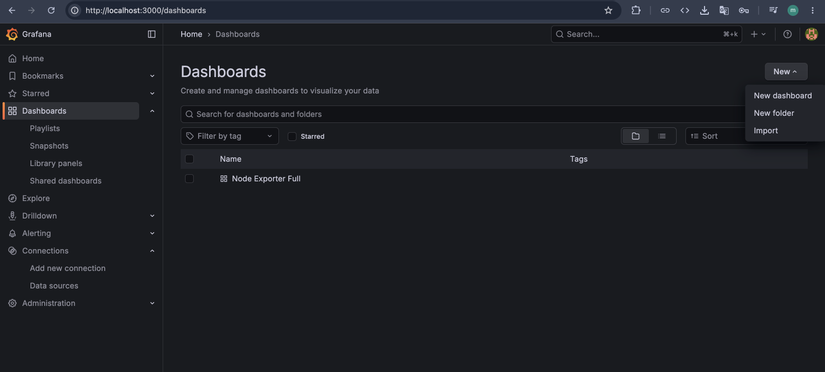
- Nhập các ID của các dashboard sau để Load vào hệ thống
- Kubernetes Cluster (ID: 7249)
- Node Exporter Full (ID: 1860)
- Kubernetes Views (ID: 15760)
- Kubernetes Pods (ID: 6417)
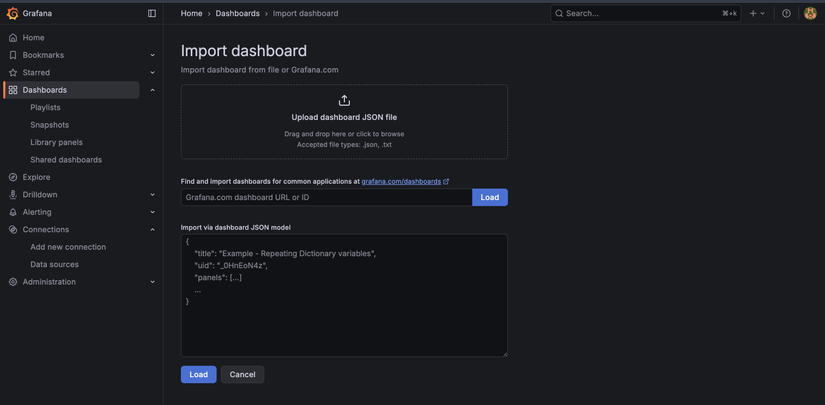
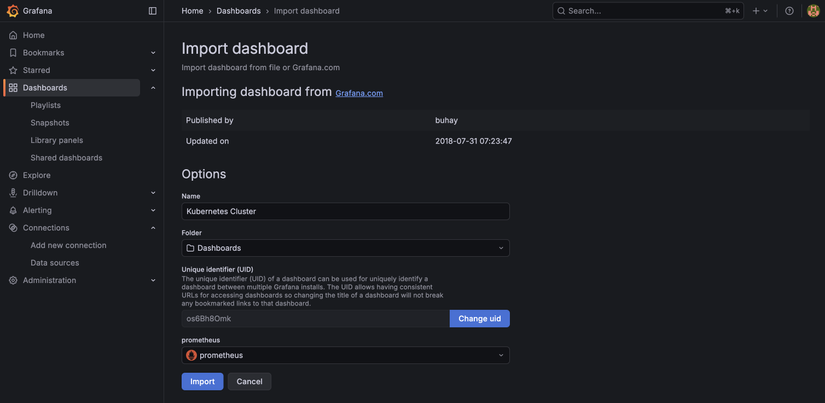
Grafana có rất nhiều Dashboard dựng sẵn.
Sau khi import, chọn Data Source:
Prometheus
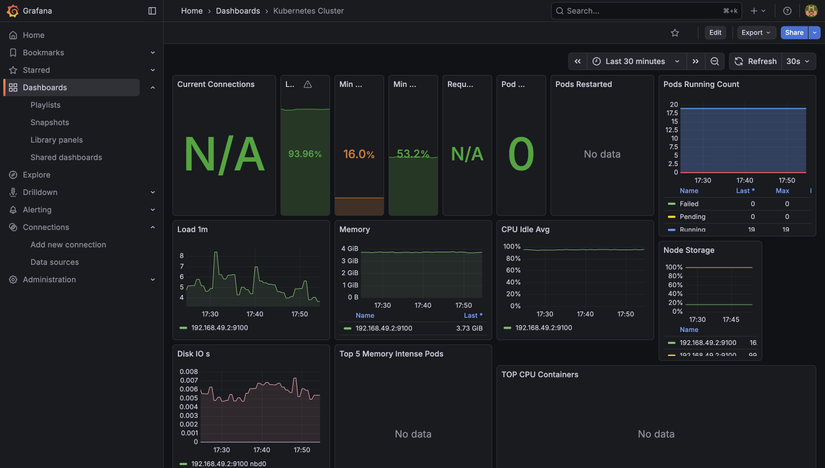
Dashboard sẽ tự hiển thị dữ liệu.
Bước 9. Thực hiện Load Test
Chạy:
ab -n 10000 -c 100 \
http://todo.company.local/api/todos
Hoặc:
k6 run script.js
Quan sát Dashboard.
Bạn sẽ thấy:
- CPU tăng
- Memory tăng
- HPA bắt đầu Scale Up
- Pod mới xuất hiện
Dashboard cập nhật gần như theo thời gian thực.
Bước 10. Thử tạo lỗi
Xóa Pod
kubectl delete pod <pod-name> -n todo-app
Quan sát Dashboard:
- Pod biến mất
- Pod mới xuất hiện
- Restart Count thay đổi
Tăng tải
Tiếp tục Load Test.
Quan sát:
- CPU tăng
- Replica tăng
- Dashboard cập nhật liên tục
Bước 11. Debug
Không có dữ liệu
Kiểm tra Data Source:
Connections

↓

Data Sources
Đảm bảo trạng thái:
Data source is working
Dashboard trống
Kiểm tra:
- Chọn đúng Prometheus Data Source
- Time Range (Last 15 minutes)
- Prometheus còn hoạt động
Không truy cập được Grafana
Kiểm tra:
kubectl get pods -n monitoring
Tiếp theo:
kubectl logs deployment/grafana -n monitoring
Dọn dẹp
Nếu không sử dụng nữa:
helm uninstall grafana -n monitoring
Hoặc giữ nguyên để sử dụng trong Lab 7.
Những gì bạn đã học
Sau bài lab này, bạn đã biết:
- ✅ Grafana là gì
- ✅ Cài Grafana bằng Helm
- ✅ Kết nối Prometheus
- ✅ Import Dashboard
- ✅ Theo dõi CPU
- ✅ Theo dõi Memory
- ✅ Theo dõi Pod
- ✅ Theo dõi Node
- ✅ Theo dõi Restart Count
- ✅ Quan sát Cluster theo thời gian thực
Bài học rút ra
Prometheus rất mạnh trong việc lưu trữ và truy vấn Metrics, nhưng không phải là công cụ phù hợp để theo dõi hệ thống hằng ngày.
Grafana giải quyết vấn đề này bằng cách biến hàng nghìn Time Series thành các Dashboard trực quan, giúp DevOps Engineer nhanh chóng phát hiện những dấu hiệu bất thường như CPU tăng cao, Memory đầy hoặc Pod liên tục khởi động lại.
Đến thời điểm này, chúng ta đã có khả năng quan sát toàn bộ Kubernetes Cluster.
Tuy nhiên, Dashboard mới chỉ cho biết hệ thống đang hoạt động như thế nào. Chúng ta vẫn chưa biết bên trong ứng dụng đang xảy ra điều gì.
Ở Lab 7, chúng ta sẽ tích hợp Spring Boot Actuator và Micrometer để xuất Application Metrics, từ đó theo dõi Request Rate, Request Latency, HTTP Status, JVM Memory và nhiều chỉ số quan trọng khác của chính ứng dụng Todo.
All rights reserved