K-Nearest Neighbors Practice
Bài đăng này đã không được cập nhật trong 4 năm
In the previous post we've learned the theory and how to classify items using K-Nearest Neighbors algorithm. So in this post lets put that into practice by writing some code to implement the theory that we've learned. You can find source code as well as the sample dataset for this post in my github repository.
Finding People of Same Interest
While I enjoy programming, watching anime and playing MMOPRG has always been such a pleasure for me as well. Wanting to find someone of the same interest, I've joined the community and hopped onto various sites that built for this purpose in mind. I though it might be good to try and apply machine learning to it, and henceforth the idea of this post. I've also collected some data that related to the users that I've interacted with in the past and categorized them into three types of categories like the following.
- User that I might not get along with
- User that I might get along with
- User that I can talk with and have the same taste just like me
The training dataset will contains hours spent on playing MMORPG per week and number of romance,comedy,action animes that he/she has watched so far along with their respective category. I'll used these features to evaluate and predict the outcome. The goal is to build a command line application that will take the input of these values and show the result of who will I be most likely to get along with. We will be using Python along with NumPy module to work with matrix data and Matplotlib module to plot all of the training dataset into a graph. In order to make this works the following steps are involve.
- Parse provided text file into 2D array using Python & NumPy module
- Analyze 2D array by plotting it on a graph using Matplotlib module
- Prepare and normalize data to make it even more accurate
- Testing a classifier with sample dataset
- Putting it all together to make a working program
Creating Matrix from Text File Using Python
To get started, we need to parse raw data from text file into a structure data that a machine can work with. We want to create one matrix contains training features and a list contains labels for the respective features. Note matrix and list will have the same number of rows (in this case is 1000). To do that we first read the text into a list that contains each line in the text file. Then we create a 2x2 matrix of size equal to the total number of lines that we've read from the file and initialize it to zero with the help of numpy.zeros function. After that we loop through each line, split it using tab character and assign the the first two columns to our early created features matrix and the last column into the labels list.
from numpy import *

def load_data(filename):
    f = open(filename)
    lines = f.readlines()
    size = len(lines)

    labels = []
    m_feats = zeros((size, 2))
    label_dict = {'not_get_along': 0, 'might_get_along': 1, 'get_along': 2}

    for i, line in enumerate(lines):
        line = line.strip()
        parts = line.split('\t')
        m_feats[i, :] = parts[0:2]
        labels.append(label_dict[parts[-1]])

    return m_feats, labels
Plotting 2D Array
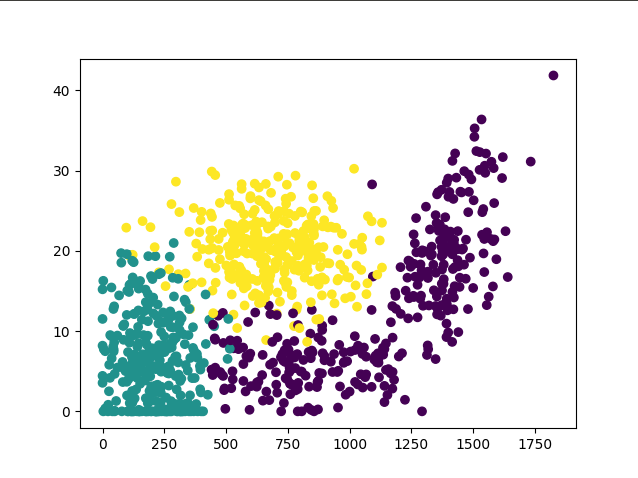
Now lets try to test a newly create function by plotting the values on a graph. We'll do this with the help of Matplotlib module. Basically all the code does is create a figure with a subplot of 1x1 size. By the way the 111 in the argument means 1x1 first subplot. Run the script and you'll probably get something like the following figure.
from matplotlib import pyplot

m_feats, labels = load_data('dataset.txt')
colors = array(labels) * 12.5 # random color

fig = pyplot.figure()
ax = fig.add_subplot(111)
ax.scatter(m_feats[:, 0], m_feats[:, 1], c=colors)
pyplot.show()
Normalize Data
If we were to get raw data and plug it into the equation, what do think would make the most difference? IMHO the big number will make the most different (suppose the number of animes greatly exceed the amount of hours spent to play mmo per week) even though we want to evaluate each feature equally. When dealing with values that vary in different ranges, it's common to normalize them. Common range that usually preferable is 0 to 1 or -1 to 1. To scale everthing from 0 to 1, we can use this formular:
newValue = (oldValue - min) / (max - min)
Lets take a look at how we normalize our dataset. Note that our dataset will be 1000x2, but min_vals only 1x2, so to make it compatible we use tile function to fill the remaining row with the copy of the original value. The same also true for range. We also take this chance to return ranges and min_vals which we will use later.
def auto_norm(dataset):
    min_vals = dataset.min(0)
    max_vals = dataset.max(0)
    ranges = max_vals - min_vals

    n = dataset.shape[0]
    n_dataset = dataset - tile(min_vals, (n, 1))
    n_dataset = n_dataset / tile(ranges, (n, 1))

    return n_dataset, ranges, min_vals
Writing Classifier Function
Ok now that we have our data in perfect shape lets take a look at how to implement our classifier function, which is an important parts of our program. We can calculate the distance using Euclidian formula. numpy.argsort function will return numpy.ndarray of indices whose values are sort in ASC order. And in the loop we get the label of the k nearest distance and increment the count of each label that we found by one and store it back into the dictionary with associated label. The last puzzle is to get the label that has the most voted count and return that label, to do that we just need to sort the dictionary by vote count using reverse order and return the first element. Because sorted function return the list of tuple pair of key and value, we write sorted_label_count[0][0]
def classify(in_a, dataset, labels, k):
    n = dataset.shape[0]
    diff_m = tile(in_a, (n, 1)) - dataset
    sq_diff_m = diff_m ** 2
    sq_distance = sq_diff_m.sum(axis=1)
    distance = sq_distance ** 0.5
    sorted_indices = distance.argsort()

    label_count = {}
    for i in range(k):
        vote_label = labels[sorted_indices[i]]
        label_count[vote_label] = label_count.get(vote_label, 1) + 1

    sorted_label_count = sorted(label_count.items(), key=operator.itemgetter(1), reverse=True)
    return sorted_label_count[0][0]
Testing Classifier
A common approach to quickly test the classifier is to take a portion of training dataset, say 10%, and use it to test against the remaining. The error rate is calculated by the number of error divided by the number of the total number of data points tested. 0 means the classifier is perfect, 1 means the classifier is garbage. On my machine I get a 4% error rate, which is not bad for my first try.
def test_classify():
    feats, labels = load_data('dataset.txt')
    n_feats, ranges, min_vals = auto_norm(feats)
    n = n_feats.shape[0]

    err_count = 0.0
    test_size = int(n * 0.1) # 10% test data
    for i in range(test_size):
        result = classify(n_feats[i, :], n_feats[test_size:n, :], labels[test_size:n], 20)
        if result != labels[i]:
            err_count += 1.0

    return err_count / float(test_size)
Complete Program
This is a completed version of our program that we can run with python 3. When the program start it will ask for user to input two of the features that we needed to evaluate and predict the result.
import operator

def get_input(message):
    return float(input(message))

def classify_person():
    display_text = ["Don't get along", 'Might get along', 'Do get along']

    gaming_hours = get_input('Hours spent on MMORPG per week: ')
    animes_num = get_input('Number of anime with romance/comedy/action that watched so far: ')

    feats, labels = load_data('dataset.txt')
    n_feats, ranges, min_vals = auto_norm(feats)

    in_a = array([animes_num, gaming_hours])
    norm_input = (in_a - min_vals) / ranges
    k = int(n_feats.shape[0] * 0.05) # Taking 5% Nearest Neighbors

    result = classify(norm_input, n_feats, labels, k)
    return display_text[result]
All rights reserved
