Classification with Machine Learning
Bài đăng này đã không được cập nhật trong 4 năm
Data scientists use classification methods to help them build predictive models that they can then use to forecast the classification of future observations. Classification is a form of supervised machine learning: The classification algorithm learns from* labeled data*. Data labels make it easier for your models to make decisions based on the logic rules you’ve defined. Your plain-vanilla clustering algorithm, like the k-means method, can help you predict subgroups from within unlabeled datasets. But there’s more to life than plain vanilla. I think it’s about time to take things one step further, by exploring the instance-based family of machine learning algorithms.
The Use case of Classification Algorithm
- Spam filtering
- Recommendation engines
- Customer segmentation
Algorithm to use with Classification
Algorithms that are part of classification are sometimes called instance-based classifiers which include:
- k-nearest neighbor (kNN)
- Self-organizing maps
- Locally weighted learning If you’re unsure about your dataset’s distribution, instance-based classifiers might be a good option, but first make sure that you know their limitations. These classifiers are not well-suited for
- Noisy data (data with unexplainable random variation)
- Datasets with unimportant or irrelevant features
- Datasets with missing values
The difference between clustering and classifying
The purpose of both clustering and classification algorithms is to make sense of, and extract value from, large sets of structured and unstructured data. If you’re working with huge volumes of unstructured data, it only makes sense to try to partition the data into some sort of logical groupings before attempting to analyze it. Both clustering and classification methods allow you to take a sweeping glance of your data en masse and then form some logical structures based on what you find there, before going deeper into the nuts-and-bolts analysis.
clustering concepts
In their simplest form, clusters are sets of unlabeled data points that share similar attribute values, and clustering algorithms are the methods that group these data points into different clusters based on their similarities. You’ll see clustering algorithms used for disease classification in medical science, but you’ll also see them used for customer classification in marketing research and for environmental health risk assessment in environmental engineering.
classification algorithms
You might have heard of classification and thought that it’s the same concept as clustering. Many people do, but this is not the case. In classification, your data is labeled, so before you analyze it, you already know the number of classes into which it should be grouped. You also already know what class you want assigned to each data point. In contrast, with clustering methods, your data is unlabeled, so you have no predefined concept of how many clusters are appropriate. You must rely on the clustering algorithms to sort and cluster the data in the most appropriate way.
With classification algorithms, you use what you know about an existing labeled dataset to generate a predictive model for classifying future observations. If your goal is to use your dataset and its known subsets to build a model for predicting the categorization of future observations, you’ll want to use classification algorithms. When implementing supervised classification, you already know your dataset’s labels — these labels are used to subset observations into classes. Classification helps you see how well your data fits into the dataset’s predefined classes so that you can then build a predictive model for classifying future observations.
Let's look at the graph below:
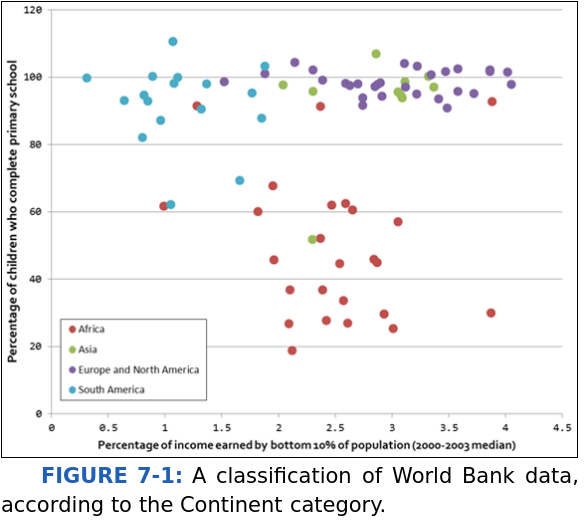
This is a classification where you already know the subsets. In clustering it is different. You don't how many cluster are there.
Algorithm to use
We will stick to explaining the k-nearest neighbor classification algorithm (known affectionately as kNN). The concepts involved in kNN are a bit tricky, though, so first I introduce you to the simpler average nearest neighbor methods before into the kNN approach. k-nearest neighbor is a supervised machine learning classifier that uses the observations it memorizes from within a test dataset to predict classifications for new, unlabeled observations. kNN makes its predictions based on similarity — the more similar the training observations are to the new, incoming observations, the more likely it is that the classifier will assign them both the same class. kNN works best if your dataset is
- Low on noise
- Free of outliers
- Labeled
- Composed only of relevant selected features
- Composed of distinguishable groups
Dataset and Implementation
KNN is a simple concept: define some distance metric between the items in your dataset, and find the K closest items. You can then use those items to predict some property of a test item, by having them somehow "vote" on it.
As an example, let's look at the MovieLens data. We'll try to guess the rating of a movie by looking at the 10 movies that are closest to it in terms of genres and popularity.
In this post we will be using Python 2.7. If you install Python 3.0 or above, you might run into some problems. Therefore I reccommend using Python 2.7.
Access the data here https://github.com/kchivorn/data
The data will be working on are u.data and u.item.
To start, we'll load up every rating in the data set into a Pandas DataFrame:
import pandas as pd

r_cols = ['user_id', 'movie_id', 'rating']
ratings = pd.read_csv('ml-100k/u.data', sep='\t', names=r_cols, usecols=range(3))
print(ratings.head())
Output
   user_id  movie_id  rating
0        0        50       5
1        0       172       5
2        0       133       1
3      196       242       3
4      186       302       3
We assume that you have already installed pandas package. if not, run this command:
pip3 install pandas
Now, we'll group everything by movie ID, and compute the total number of ratings (each movie's popularity) and the average rating for every movie:
import numpy as np

movieProperties = ratings.groupby('movie_id').agg({'rating': [np.size, np.mean]})
movieProperties.head()
Output
 size      mean
movie_id
1           452  3.878319
2           131  3.206107
3            90  3.033333
4           209  3.550239
5            86  3.302326
The raw number of ratings isn't very useful for computing distances between movies, so we'll create a new DataFrame that contains the normalized number of ratings. So, a value of 0 means nobody rated it, and a value of 1 will mean it's the most popular movie there is.
movieNumRatings = pd.DataFrame(movieProperties['rating']['size'])
movieNormalizedNumRatings = movieNumRatings.apply(lambda x: (x - np.min(x)) / (np.max(x) - np.min(x)))
movieNormalizedNumRatings.head()
Output
movie_id
1         0.773585
2         0.222985
3         0.152659
4         0.356775
5         0.145798
Now, let's get the genre information from the u.item file. The way this works is there are 19 fields, each corresponding to a specific genre - a value of '0' means it is not in that genre, and '1' means it is in that genre. A movie may have more than one genre associated with it. While we're at it, we'll put together everything into one big Python dictionary called movieDict. Each entry will contain the movie name, list of genre values, the normalized popularity score, and the average rating for each movie:
movieDict = {}
with open(r'ml-100k/u.item', encoding='ISO-8859-1') as f:
    temp = ''
    for line in f:
        fields = line.rstrip('\n').split('|')
        movieID = int(fields[0])
        name = fields[1]
        genres = fields[5:25]
        genres = map(int, genres)
        movieDict[movieID] = (name, genres, movieNormalizedNumRatings.loc[movieID].get('size'), movieProperties.loc[movieID].rating.get('mean'))

print(movieDict[1])
Output
('Toy Story (1995)', [0, 0, 0, 1, 1, 1, 0, 0, 0, 0, 0, 0, 0, 0, 0, 0, 0, 0, 0], 0.77358490566037741, 3.8783185840707963)
Now let's define a function that computes the "distance" between two movies based on how similar their genres are, and how similar their popularity is. Just to make sure it works, we'll compute the distance between movie ID's 2 and 4:
from scipy import spatial

def ComputeDistance(a, b):
    genresA = list(a[1])
    genresB = list(b[1])
    genreDistance = spatial.distance.cosine(genresA, genresB)
    popularityA = a[2]
    popularityB = b[2]
    popularityDistance = abs(popularityA - popularityB)
    return genreDistance + popularityDistance

print(ComputeDistance(movieDict[1], movieDict[10]))
Remember the higher the distance, the less similar the movies are. Let's check what movies 2 and 4 actually are - and confirm they're not really all that similar:
print movieDict[1]
print movieDict[10]
Output
('Toy Story (1995)', [0, 0, 0, 1, 1, 1, 0, 0, 0, 0, 0, 0, 0, 0, 0, 0, 0, 0, 0], 0.77358490566037741, 3.8783185840707963)
('Richard III (1995)', [0, 0, 0, 0, 0, 0, 0, 0, 1, 0, 0, 0, 0, 0, 0, 0, 0, 1, 0], 0.15094339622641509, 3.8314606741573032)
Now, we just need a little code to compute the distance between some given test movie (Toy Story, in this example) and all of the movies in our data set. When the sort those by distance, and print out the K nearest neighbors:
import operator

def getNeighbors(movieID, K):
    distances = []
    for movie in movieDict:
        if (movie != movieID):
            dist = ComputeDistance(movieDict[movieID], movieDict[movie])
            distances.append((movie, dist))
    distances.sort(key=operator.itemgetter(1))
    neighbors = []
    for x in range(K):
        neighbors.append(distances[x][0])
    return neighbors

K = 10
avgRating = 0
neighbors = getNeighbors(1, K)
for neighbor in neighbors:
    avgRating += movieDict[neighbor][3]
    print movieDict[neighbor][0] + " " + str(movieDict[neighbor][3])

avgRating /= float(K)
print avgRating
Output
Liar Liar (1997) 3.15670103093
Aladdin (1992) 3.81278538813
Willy Wonka and the Chocolate Factory (1971) 3.63190184049
Monty Python and the Holy Grail (1974) 4.0664556962
Full Monty, The (1997) 3.92698412698
George of the Jungle (1997) 2.68518518519
Beavis and Butt-head Do America (1996) 2.78846153846
Birdcage, The (1996) 3.44368600683
Home Alone (1990) 3.08759124088
Aladdin and the King of Thieves (1996) 2.84615384615
3.34459059002
Conclusion
I think we can improve more on the algorithm:
- How we define the similarity of two movies, that how to measure the distance between to movies
- How the number of neighborhood K affect the result.
All rights reserved
