Advice for Applying Machine Learning
Bài đăng này đã không được cập nhật trong 4 năm
There are various types of algorithm and techniques in machine learning but there is a big difference between someone who knows an algorithm vs. someone less familiar and doesn't understand how to apply them. We always learn how to chose the best avenues to explore the various techniques. In this post focus will be given on deciding what avenues to try.
Debugging a learning algorithm
let's say we have implemented regularized linear regression to predict housing prices. Equation for this will be like this
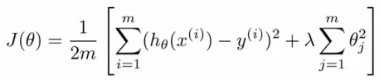
We have trained it with good data set. But it showed unexpected large errors in its prediction at the time of testing on new data. So what to do next to lessen this error in prediction. There are many things we can do.
1. Get more training data: Sometimes more data does not help. Often it does though, but always have to do some preliminiary testing to make sure it works 2. Try a smaller set a features: Have to select small subset carefully. 3. Try getting additional features: Can be very time consuming and sometimes not that helpful. 4. Building your own, new, better features: Can be risky if accidentally over fit data by creating new features which are inherently specific/relevant to your training data. 5. Try decreasing or increasing λ: based on the importance of regularization term in calculation it sometimes show result.
These changes can become major issue for a long time. So it is important to choose a workable way. Sadly, most common method for choosing one of these examples is to go by gut feeling. Many times, it is seen that people spend huge amounts of time only to discover that the avenue is fruitless. There are some simple techniques which can let us rule out half the things on the list. These can take time to implement and understand, but still, they can also save you spending months going down an avenue which will never work.
Evaluating a hypothesis
When we fit parameters to training data, we try to minimize the error. We might think a low error is good - doesn't necessarily mean a good parameter set. This could in fact be indicative of overfitting that means our model will fail to generalize. We can plot hθ(x) to determine if a hypothesis is overfitting or not. But sometimes it is quite impossible to plot a calculation with lots of feature. Standard way to evaluate a hypothesis is:
- Split data into two portions - 1st portion is training set and the rest is test set. Typical split might be 70:30 (training:test)
- Learn parameters θ from training data, minimizing J(θ)
- Compute the test error and continue
Model selection and training validation test sets
In this part we will know how to choose regularization parameter or degree of polynomial. FIrst of all, a model has been chosen and determine test set error to see how well hypothesis will generalize. But, this is going to be an optimistic estimate of generalization error, because our parameter is fit to that test set. So not a good way to evaluate if it will generalize. To address this problem, we do something a bit different for model selection. So to improve our model we will split our data set into three pieces 1 - Training set (60%) - m values 2 - Cross validation (CV) set (20%)mcv 3 - Test set (20%) mtest So we will now minimize cost function for each of the models as before and Test these hypothesis on the cross validation set to generate the cross validation error. Estimate generalization error of model using the test set
Bias vs Variance
The reason of getting bad result is usually because of one of
- High bias - under fitting problem
- High variance - over fitting problem
It is important to know which is the problem because knowing will let us improve the algorithm. Lets define training and cross validation error as before. After plotting degree of polynomial, d vs error for both training and cross validation, we will get something like this
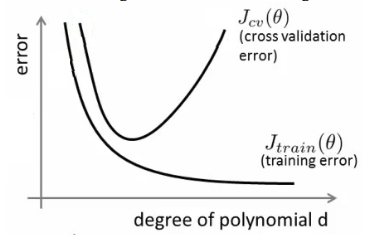
For high bias, CV error and test set error will be very similiar and for high variance, there will be big gap between them. so if d is small, there is a probability of being high bias and if d is large, there is possibility of high variance.
Learning curves
A learning curve is often useful to plot for algorithmic sanity checking or improving performance. Plot Jtrain (average squared error on training set) or Jcv (average squared error on cross validation set). Plot against m (number of training examples)
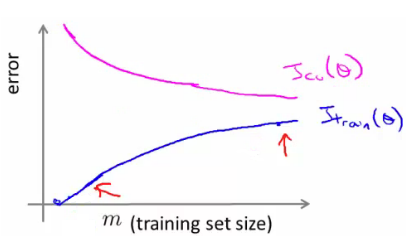 for high bias, Training error is small at first and grows. Training error becomes close to cross validation. So the performance of the cross validation and training set end up being similar. The problem with high bias is because cross validation and training error are both high. Also implies that if a learning algorithm as high bias as we get more examples the cross validation error doesn't decrease.
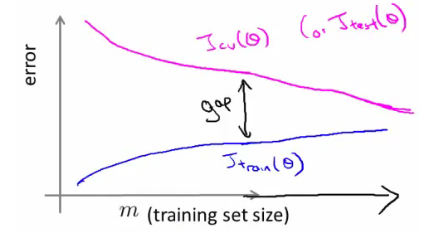 For high variance, When set is small, training error is small too. As training set sizes increases, value is still small but slowly increases. CV error remains high, even when you have a moderate number of examples.
These are clean curves. In reality the curves you get are far dirtier. But, learning curve plotting can help diagnose the problems your algorithm will be suffering from. So now we can visualise which technique will be useful after knowing the error
Get more examples: helps to fix high variance but not good if you have high bias Smaller set of features: fixes high variance (overfitting) but not good if you have high bias Try adding additional features: fixes high bias Add polynomial terms: fixes high bias problem Decreasing λ: fixes high bias Increases λ: fixes high variance
ha5
All rights reserved
