100 ngày học DevOps (ngày 1)
Bài đăng này đã không được cập nhật trong 6 năm
Chào mừng bạn đến với Ngày 1 trong 100 ngày của DevOps, tôi muốn bắt đầu hành trình này với một trong những khái niệm quan trọng nhất trong Giám sát và cảnh báo DevOps. Các bạn có thể theo dõi 100 ngày Devops tại đây Link
Vấn đề cần quan tâm :
Tạo CloudWatch Alert gửi email bằng thông báo SNS khi Sử dụng CPU hơn 70%. Tạo alert kiểm tra trạng thái sức khỏe và kiểm tra lỗi Hệ thống khi thất bại gửi và email bằng thông báo SNS Giải pháp :
Điều này có thể thực hiện thông qua một trong 3 cách bên dưới .
- AWS Console
- AWS CLI
- Terraform
LƯU Ý: Đây không phải là danh sách đầy đủ và có nhiều cách hơn để đạt được điều tương tự
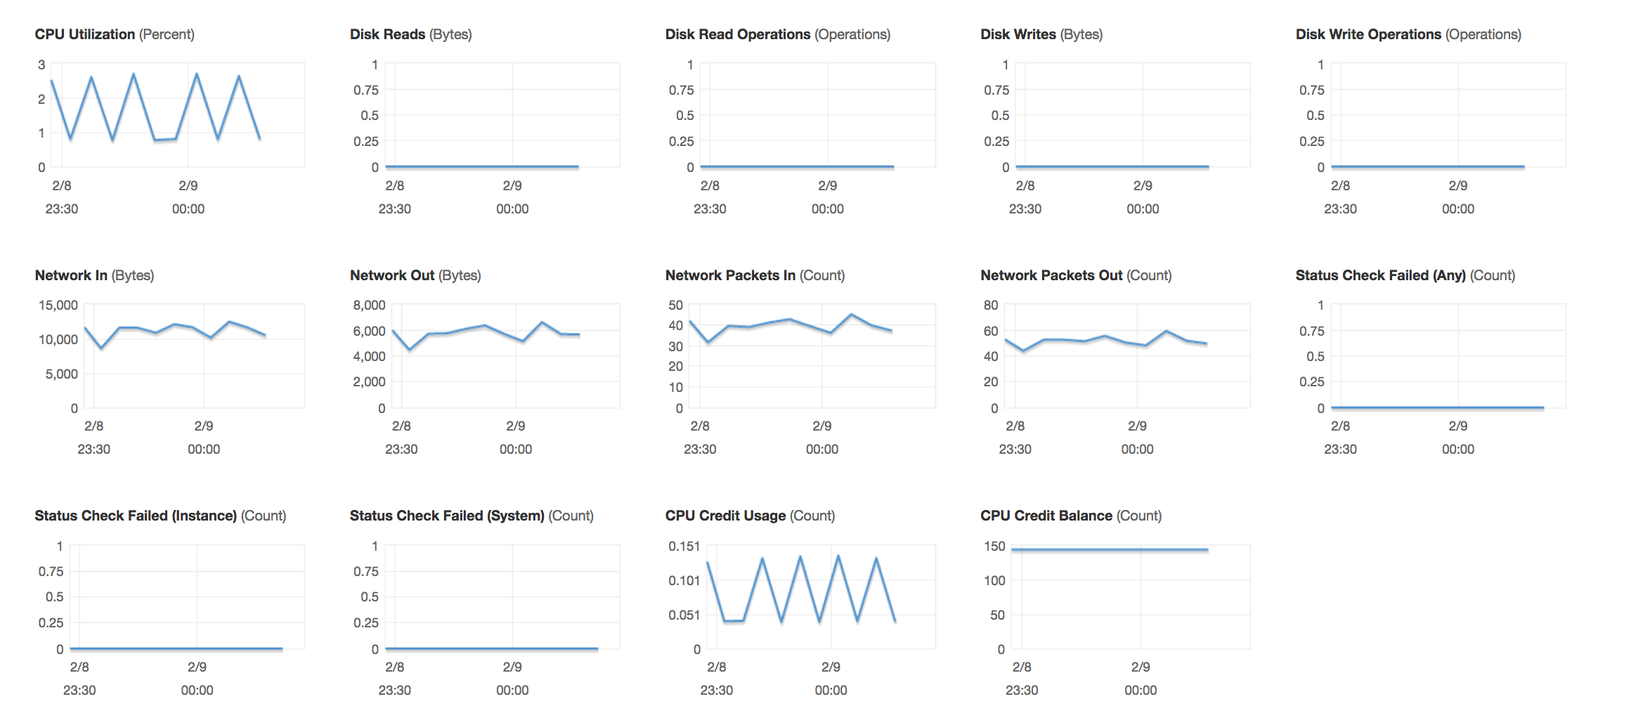
| CloudWatch là gì?
| AWS CloudWatch là một dịch vụ giám sát để giám sát tài nguyên AWS, cũng như các ứng dụng chạy trên AWS.
CloudWatch sẽ theo dõi mặc định những thông số bên dưới .
- CPU
- Network
- Disk

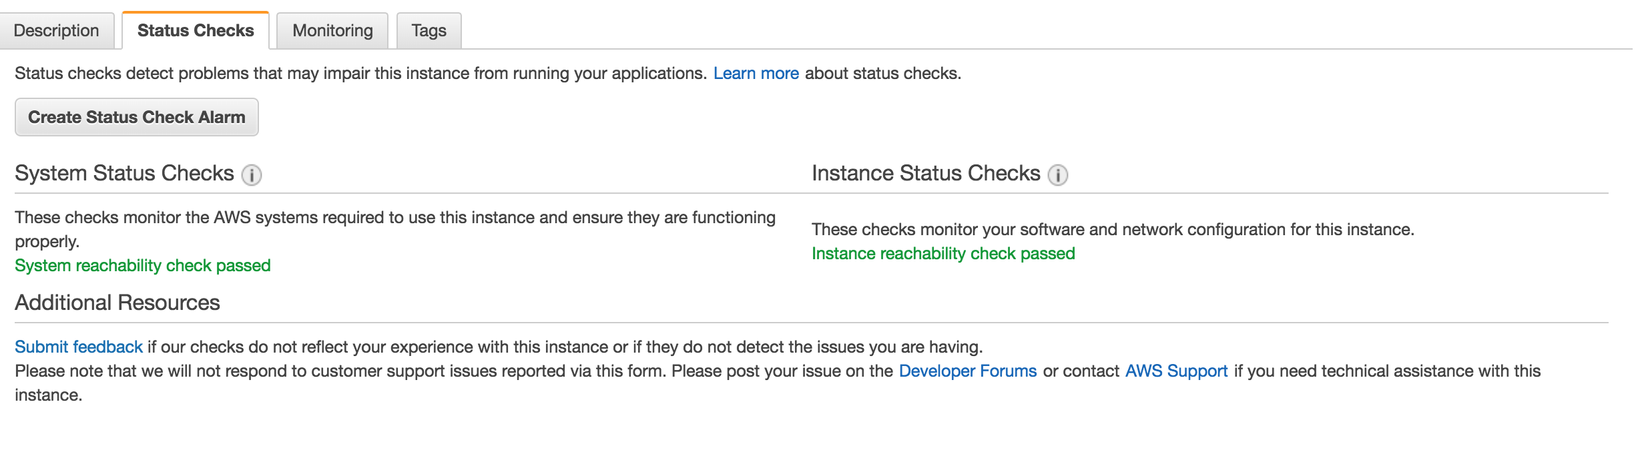
Status Check :
Có hai loại kiểm tra trạng thái dịch vụ AWS .
System status check:
Giám sát hệ thống AWS nơi những instance của bạn đang chạy .Nó yêu cầu sự tham gia của AWS để repair hoặc bạn có thể tự sửa nó bằng cách stop / start thể hiện (trong trường hợp khối lượng EBS)
- Loss of network connectivity
- Loss of system power
- Software issues on the physical host
- Hardware issues on the physical host that impact network reachability
Instance status check:
Giám sát cấu hình phần mềm và network của một instance, Nó kiểm tra / phát hiện các vấn đề đòi hỏi sự tham gia của bạn để sửa chữa.
- Incorrect networking or startup configuration
- Exhausted memory
- Corrupted filesystem
- Incompatible kernel
NOTE :
- Memory / RAM là số liệu tùy chỉnh
- Theo default, giám sát EC2 là các khoảng thời gian 5 phút nhưng tôi luôn có thể kích hoạt giám sát chi tiết (khoảng thời gian 1 phút, nhưng điều đó sẽ khiến bạn mất thêm $$$)
**P.S: **
CloudWatch cũng có thể được sử dụng trên tiền đề. Chúng ta chỉ cần cài đặt SSM (System Manager) và CloudWatch agent Khái niệm lý thuyết đủ rồi, hãy thiết lập báo thức CloudWatch
Kịch bản 1:
Tôi muốn tạo một cảnh báo từ CloudWatch gửi email bằng thông báo SNS khi mức độ sử dụng CPU là hơn 70%

Solution 1:
Thiết lập alert sử dụng CPU bằng Bảng điều khiển quản lý AWS.
- Open the CloudWatch console athttps://console.aws.amazon.com/cloudwatch/.
- In the navigation pane, choose Alarms, Create Alarm.
- Go to Metric → Select metric → EC2 → Per-Instance-Metrics → CPU Utilization → Select metric
![]()
![]()


Define the Alarm as follows* Type the unique name for the alarm(eg: HighCPUUtilizationAlarm)
* Description of the alarm
* Under whenever,choose >= and type 70, for type 2. This specify that the alarm is triggered if the CPU usage is above 70% for two consecutive sampling period
* Under Additional settings, for treat missing data as, choose bad(breaching threshold), as missing data points may indicate that the instance is down
* Under Actions, for whenever this alarm, choose state is alarm. For Send notification to, select an exisiting SNS topic or create a new one
* To create a new SNS topic, choose new list, for send notification to, type a name of SNS topic(for eg: HighCPUUtilizationThreshold) and for Email list type a comma-seperated list of email addresses to be notified when the alarm changes to the ALARM state.
* Each email address is sent to a topic subscription confirmation email. You must confirm the subscription before notifications can be sent.
* Click on Create Alarm

Solution 2:
Thiết lập cảnh báo sử dụng CPU bằng AWS CLI
- Tạo một alert bằng cách sử dụng lệnh put-metric-alarm
aws cloudwatch put-metric-alarm --alarm-name cpu-mon --alarm-description "Alarm when CPU exceeds 70 percent" --metric-name CPUUtilization --namespace AWS/EC2 --statistic Average --period 300 --threshold 70 --comparison-operator GreaterThanThreshold --dimensions "Name=InstanceId,Value=i-12345678" --evaluation-periods 2 --alarm-actions arn:aws:sns:us-east-1:111122223333:MyTopic --unit Percent
-
Sử dụng command, chúng ta có thể kiểm tra alert bằng cách buộc thay đổi trạng thái cảnh báo bằng lệnh set-alarm-state
-
Thay đổi trạng thái alert từ INSUFFICIENT_DATA thành OK
aws cloudwatch set-alarm-state --alarm-name "cpu-monitoring" --state-reason "initializing" --state-value OK
- Thay đổi trạng thái Alert từ OK sang ALARM
aws cloudwatch set-alarm-state --alarm-name "cpu-monitoring" --state-reason "initializing" --state-value ALARM
- Kiểm tra xem bạn đã nhận được thông báo qua email về báo thức chưa
Solution 3 :
- Thiết lập cảnh báo sử dụng CPU bằng cách sử dụng Terraform, chúng ta tạo 1 file terraform .tf
cloudwatch.tfresource "aws_cloudwatch_metric_alarm" "cpu-utilization" {
  alarm_name                = "high-cpu-utilization-alarm"
  comparison_operator       = "GreaterThanOrEqualToThreshold"
  evaluation_periods        = "2"
  metric_name               = "CPUUtilization"
  namespace                 = "AWS/EC2"
  period                    = "120"
  statistic                 = "Average"
  threshold                 = "80"
  alarm_description         = "This metric monitors ec2 cpu utilization"
  alarm_actions             = [ "${aws_sns_topic.alarm.arn}" ]dimensions {
    InstanceId = "${aws_instance.my_instance.id}"
  }
}
Kịch bản 2 : Tạo một Alert kiểm tra trạng thái và thông báo khi một instance bị failed (shutdown)
Solution 1: Tạo Alert kiểm tra trạng thái bằng Bảng điều khiển AWS
- Open the Amazon EC2 console at https://console.aws.amazon.com/ec2/.
- In the navigation pane, choose Instances.
- Select the instance, choose the Status Checks tab, and choose to Create Status Check Alarm.
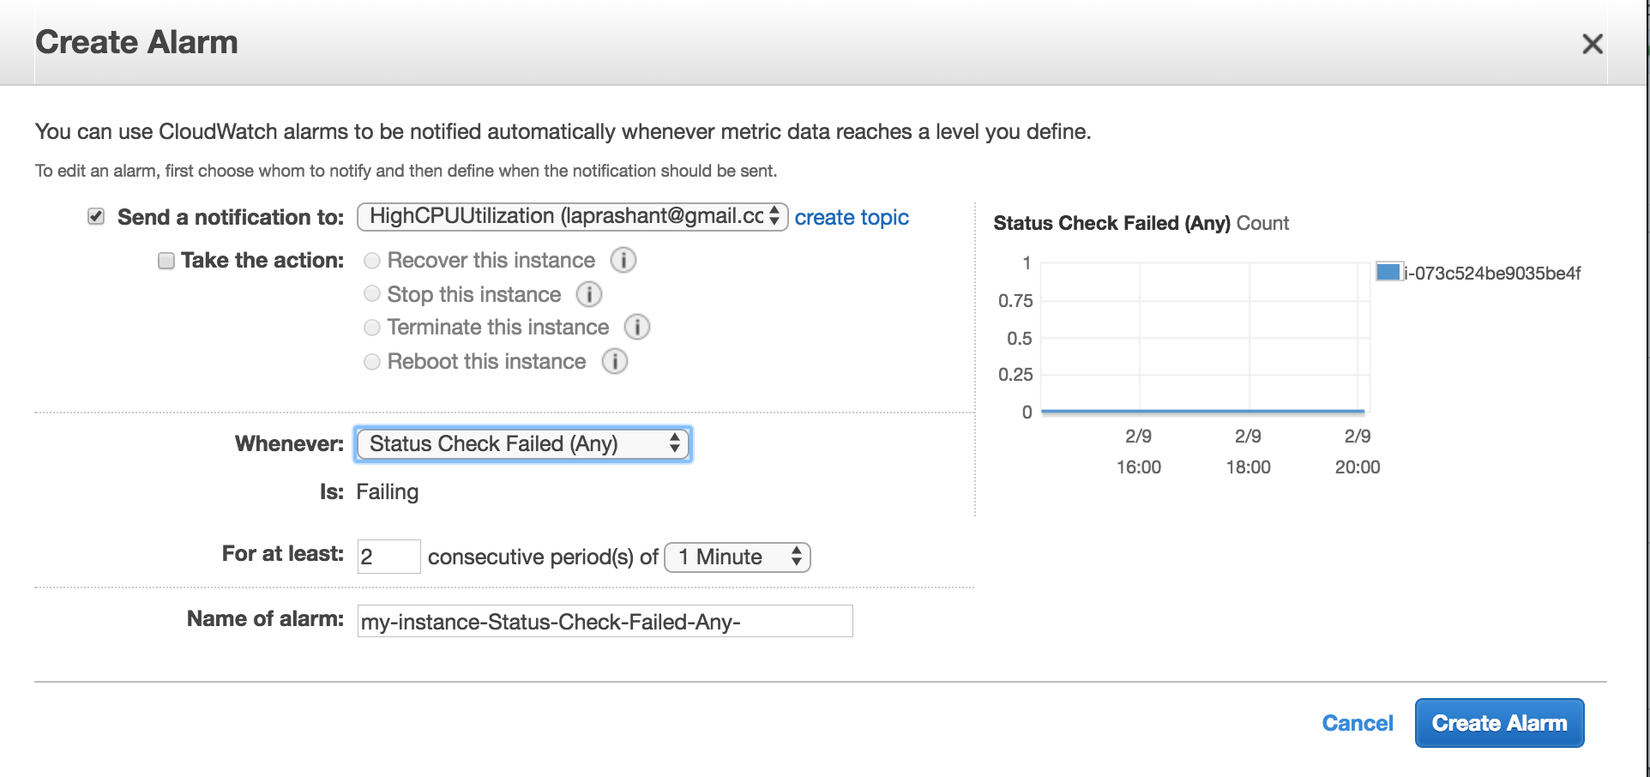
* You can create new SNS notification or use the exisiting one(I am using the existing one create in earlier example of high CPU utilization)
* In Whenever, select the status check that you want to be notified about(options Status Check Failed(Any), Status Check Failed(Instance) and Status Check Failed(System)
* In For at least, set the number of periods you want to evaluate and in consecutive periods, select the evaluation period duration before triggering the alarm and sending an email.
* In Name of alarm, replace the default name with another name for the alarm.
* Choose Create Alarm.
Solution 2 :
Để tạo Alert kiểm tra trạng thái qua thông qua AWS CLI
- Sử dụng lệnh put-metric-alarm để tạo Alert
aws cloudwatch put-metric-alarm --alarm-name StatusCheckFailed-Alarm-for-test-instance --metric-name StatusCheckFailed --namespace AWS/EC2 --statistic Maximum --dimensions Name=InstanceId,Value=i-1234567890abcdef0 --unit Count --period 300 --evaluation-periods 2 --threshold 1 --comparison-operator GreaterThanOrEqualToThreshold --alarm-actions arn:aws:sns:us-west-2:111122223333:my-sns-topic
Solution 3 :
Để tạo Alert kiểm tra trạng thái qua viết Terraform
resource "aws_cloudwatch_metric_alarm" "instance-health-check" {
  alarm_name                = "instance-health-check"
  comparison_operator       = "GreaterThanOrEqualToThreshold"
  evaluation_periods        = "1"
  metric_name               = "StatusCheckFailed"
  namespace                 = "AWS/EC2"
  period                    = "120"
  statistic                 = "Average"
  threshold                 = "1"
  alarm_description         = "This metric monitors ec2 health status"
  alarm_actions             = [ "${aws_sns_topic.alarm.arn}" ]dimensions {
    InstanceId = "${aws_instance.my_instance.id}"
  }
}
Chúng ta đã kết thúc ngày 1 trong 100 ngày Devops .. Hẹn các bạn vào thứ 4 hàng tuần nha . Nguồn : https://techzones.me/2019/09/25/day-1-cloudwatch-metrics/
All rights reserved
