Vẽ biểu đồ - đồ thị
Bài đăng này đã không được cập nhật trong 4 năm
Trong mỗi chúng ta, mỗi người đều phải tự quản lý một công việc nào đó, đơn giản như quản lý cá nhân chẳng hạn, và để nhìn một cách tổng quan nhất về tiến trình công việc, bạn cần phải có report dưới dạng biểu đồ (đồ thị). Trong thời đại công nghệ phát triển cao, smart phone rất phổ biến, thì việc sử dụng smart phone để quản lý cá nhân là rất hữu ích. Thời gian gần đây có rất nhiều ứng dụng di động giúp bạn thống kê các thông tin cá nhân như: sức khoẻ, tài chính, công việc, ..., và tất nhiên report dưới dạng biểu đồ là không thể thiếu.
Có rất nhiều loại biểu đồ khác nhau, trong bài viết này mình sẽ hưỡng dẫn vẽ 3 loại biểu đồ thông dụng nhất là: Biểu đồ đường biểu diễn, biểu đồ hình cột và biểu đồ hình tròn.
Hiện tại có rất nhiều thư viện support vẽ biểu đồ trên iOS, nhưng thư viện đầy đủ và được dùng nhiều nhất là https://github.com/danielgindi/ios-charts của tác giả Daniel Cohen Gindi hiện là CTO của Netsource Ltd - Israel
- Setting
- Download lib tại địa chỉ https://github.com/danielgindi/ios-charts
- Tạo một project mới
- Copy Charts.xcodeproj (từ lib vừa tải về) vào project mới của mình (chú ý phải copy cả vào project chứ ko phải reference)
- Add framework Charts.framework vào project của mình Như thế là đã import xong library.
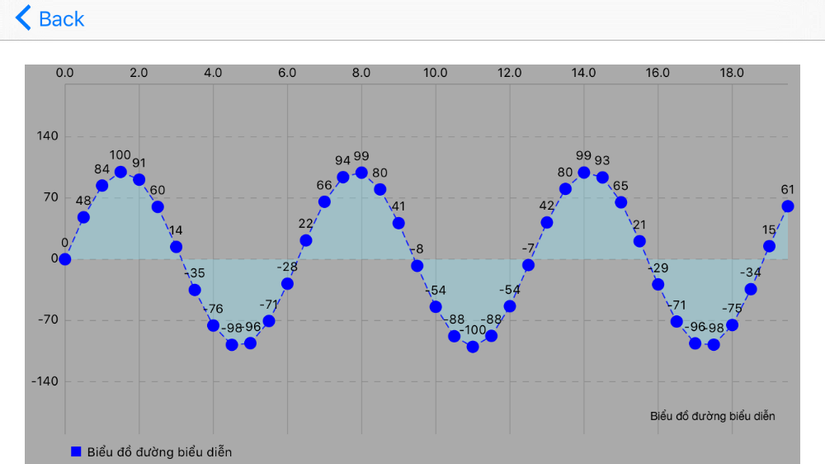
- Biểu đồ đường biểu diễn Ở ví dụ này mình sẽ hưỡng dẫn vẽ biểu đồ hình sin: y = 100 * sin(x) Vẽ 40 điểm Khởi tạo chartView
func initLineChart () {
    chartView.delegate = self
    chartView.descriptionText = "Biểu đồ đường biểu diễn"
    chartView.noDataTextDescription = "Bạn cần cung cấp dữ liệu cho biểu đồ"
    chartView.dragEnabled = true
    chartView.setScaleEnabled(true)
    chartView.pinchZoomEnabled = true
    chartView.drawGridBackgroundEnabled = false
    chartView.rightAxis.enabled = false
    chartView.viewPortHandler.setMaximumScaleY(2)
    chartView.viewPortHandler.setMaximumScaleX(2)
    chartView.animate(xAxisDuration: 2.5, easingOption: ChartEasingOption.EaseInOutQuart)

    let leftAxis = chartView.leftAxis
    leftAxis.removeAllLimitLines()
    leftAxis.customAxisMax = 200;
    leftAxis.customAxisMin = -200;
    leftAxis.gridLineDashLengths = [5, 5]
    leftAxis.drawZeroLineEnabled = false
    leftAxis.drawLimitLinesBehindDataEnabled = true
}
Set dữ liệu đầu vào
func setLineChartData() {
    chartView.data = nil
    var xVals: [String] = []
    var yVals: [ChartDataEntry] = []
    var index: Int = 0
    for(var i: Double = 0; i < 20; i += 0.5) {
        xVals.append("\(i)")
        let yValue = 100 * sin(i)
        yVals.append(ChartDataEntry(value: yValue, xIndex: index))
        index += 1
    }

    let set1 = LineChartDataSet(yVals: yVals, label: "Biểu đồ đường biểu diễn")
    set1.lineDashLengths = [5, 2.5]
    set1.highlightLineDashLengths = [5, 2.5]
    set1.setColor(UIColor.blueColor())
    set1.setCircleColor(UIColor.blueColor())
    set1.lineWidth = 1
    set1.circleRadius = 5.0
    set1.drawCircleHoleEnabled = false
    set1.valueFont = UIFont.systemFontOfSize(10)
    set1.drawFilledEnabled = true
    var dataSets : [LineChartDataSet] = []
    dataSets.append(set1)
    let data = LineChartData(xVals: xVals, dataSets: dataSets)
    chartView.data = data
}
kết quả sẽ được
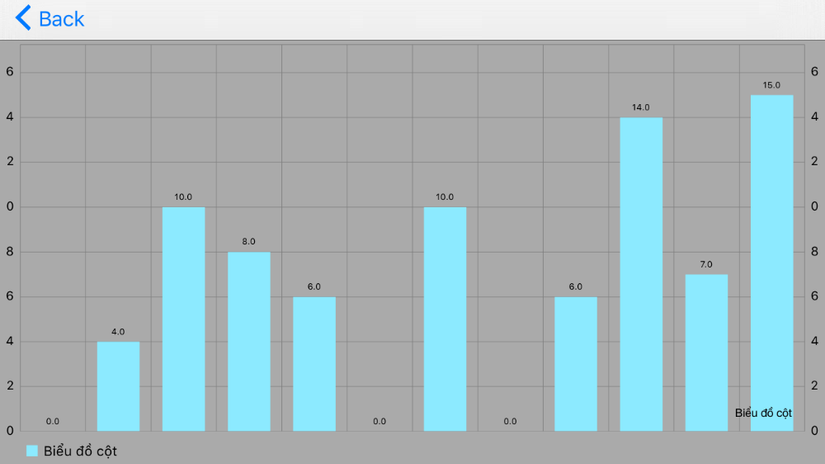
- Biểu đồ hình cột Khởi tạo chartView
func initBarChart() {
    chartView.delegate = self
    chartView.descriptionText = "Biểu đồ cột"
    chartView.noDataTextDescription = "Bạn cần cung cấp dữ liệu cho biểu đồ"
    chartView.dragEnabled = true
    chartView.setScaleEnabled(true)
    chartView.pinchZoomEnabled = true
    chartView.drawGridBackgroundEnabled = false
    chartView.rightAxis.enabled = true
    chartView.drawBarShadowEnabled = false
    chartView.drawValueAboveBarEnabled = true
    chartView.maxVisibleValueCount = 60
    chartView.legend.formSize = 9.0;
    chartView.legend.font = UIFont.systemFontOfSize(11)
    chartView.legend.xEntrySpace = 4.0;
    chartView.animate(xAxisDuration: 1.4)

    let leftAxis = chartView.leftAxis
    leftAxis.labelCount = 8
    leftAxis.valueFormatter = NSNumberFormatter()
    leftAxis.valueFormatter?.maximumIntegerDigits = 1
    leftAxis.spaceTop = 0.15
    leftAxis.customAxisMin = 0

    let rightAxis = chartView.rightAxis
    rightAxis.enabled = true
    rightAxis.drawGridLinesEnabled = false
    rightAxis.labelFont = UIFont.systemFontOfSize(10)
    rightAxis.labelCount = 8
    rightAxis.valueFormatter = leftAxis.valueFormatter
    rightAxis.spaceTop = 0.15
    rightAxis.customAxisMin = 0.0
}
Set dữ liệu đầu vào
func setBarChartData() {
    chartView.data = nil
    var xVals: [String] = []
    var yVals: [ChartDataEntry] = []
    for i in 0...11 {
        xVals.append(months[i])
        let yValue = Double(arc4random_uniform(UInt32(i+10)))
        yVals.append(BarChartDataEntry(value: yValue, xIndex: i))
    }
    let set1 = BarChartDataSet(yVals: yVals, label: "Biểu đồ cột")
    set1.barSpace = 0.35
    var dataSets : [BarChartDataSet] = []
    dataSets.append(set1)
    let data = BarChartData(xVals: xVals, dataSets: dataSets)
    chartView.data = data
}
kết quả sẽ được
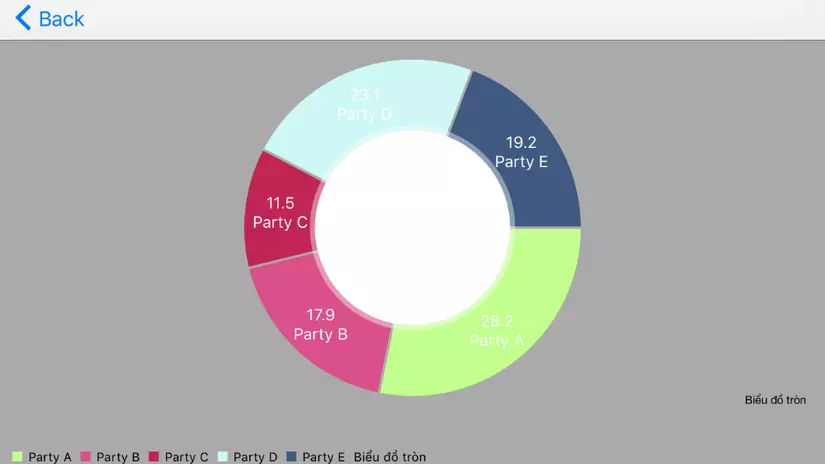
- Biểu đồ hình tròn Khởi tạo chartView
func setCircleChartView() {
    chartView.usePercentValuesEnabled = true
    chartView.drawSlicesUnderHoleEnabled = false
    chartView.holeRadiusPercent = 0.58;
    chartView.transparentCircleRadiusPercent = 0.61;
    chartView.descriptionText = "Biểu đồ tròn"
    chartView.noDataTextDescription = "Bạn cần cung cấp dữ liệu cho biểu đồ"
    chartView.setExtraOffsets(left: 5, top: 10, right: 5, bottom: 5)
    chartView.drawCenterTextEnabled = true
    chartView.drawHoleEnabled = true
    chartView.rotationAngle = 0
    chartView.rotationEnabled = true
    chartView.highlightPerTapEnabled = true
    let legend = chartView.legend
    legend.xEntrySpace = 7.0
    legend.yEntrySpace = 0.0
    legend.yOffset = 0.0
    chartView.animate(xAxisDuration: 1.4)
}
Set dữ liệu đầu vào
func setCircleChartData() {
    chartView.data = nil
    var xVals: [String] = []
    var yVals: [ChartDataEntry] = []
    for i in 0...4 {
        xVals.append(parties[i % parties.count])
        let yValue = Double(arc4random_uniform(UInt32(i+30)))
        yVals.append(BarChartDataEntry(value: yValue, xIndex: i)) // IMPORTANT: In a PieChart, no values (Entry) should have the same xIndex (even if from different DataSets), since no values can be drawn above each other.
    }
    let dataSet = PieChartDataSet(yVals: yVals, label: "Biểu đồ tròn")
    dataSet.sliceSpace = 2.0
    //add color
    var colors: [NSUIColor] = []
    colors.append(ChartColorTemplates.vordiplom()[0])
    colors.append(ChartColorTemplates.joyful()[0])
    colors.append(ChartColorTemplates.colorful()[0])
    colors.append(ChartColorTemplates.liberty()[0])
    colors.append(ChartColorTemplates.pastel()[0])
    dataSet.colors = colors
    var dataSets : [PieChartDataSet] = []
    dataSets.append(dataSet)
    let data = PieChartData(xVals: xVals, dataSets: dataSets)
    chartView.data = data
}
kết quả sẽ được
Đây là source code tham khảo: https://github.com/phanthanhhai/charts
All rights reserved
