Vẽ biểu đồ (chart) cho trang web bằng HTML và Google Charts
Bài đăng này đã không được cập nhật trong 7 năm

Chào mọi người, trong bài viết này chúng ta sẽ tìm hiểu cách vẽ biểu đồ cho website 1 cách đơn giản dễ làm với HTML và Google Charts. Đầu tiên các bạn tạo 1 file HTML và nhập đoạn code sau:
<!DOCTYPE html>

<html>

<body>


<h1>My Web Page</h1>


<div id="piechart"></div>


</body>

<html>


Kế đến thêm đoạn script chứa API của google:


<script type="text/javascript" src="https://www.gstatic.com/charts/loader.js"></script>


Cuối cùng add đoạn Javascript sau:


<script type="text/javascript">
// Load google chartsgoogle.charts.load('current', {'packages':['corechart']});
google.charts.setOnLoadCallback(drawChart);

// Draw the chart and set the chart valuesfunction drawChart() {
  var data = google.visualization.arrayToDataTable([
  ['Task', 'Hours per Day'],
  ['Work', 8],
  ['Friends', 2],
  ['Eat', 2],
  ['TV', 3],
  ['Gym', 2],
  ['Sleep', 7]
]);

  // Optional; add a title and set the width and height of the chart  var options = {'title':'My Average Day', 'width':400, 'height':300};

  // Display the chart inside the <div> element with id="piechart"  var chart = new google.visualization.PieChart(document.getElementById('piechart'));
  chart.draw(data, options);
}</script>
Kết quả ta được biểu đồ sau
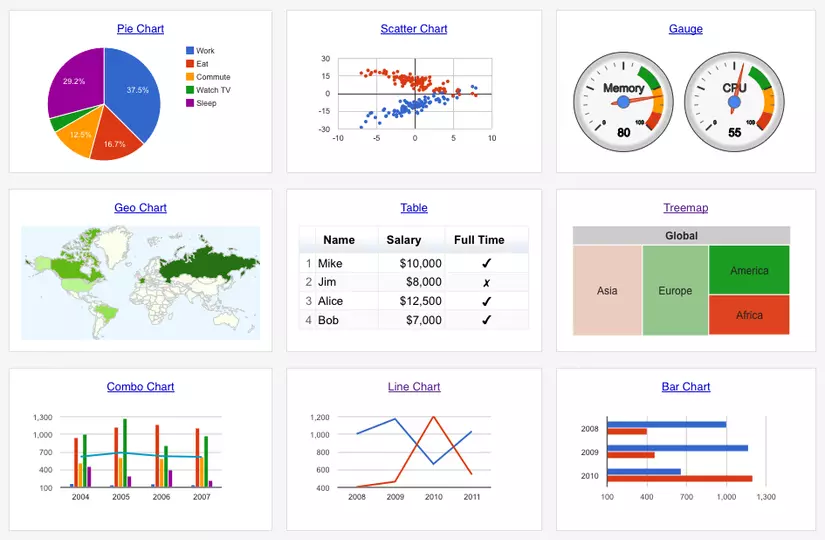
Các bạn xem thêm các biểu đồ khác của Google tại đây: https://google-developers.appspot.com/chart/
All rights reserved