Theo dõi dung lượng lưu trữ và cài đặt cảnh báo trên Amazon EC2 (Phần 1)
Bài đăng này đã không được cập nhật trong 6 năm
Chắc hẵn khi sữ dụng dịch vụ EC2 của AWS chúng ta đều mong muốn theo dõi dung lượng lưu trữ đã sữ dụng, tracking dung lượng ram để xem thử đã đáp ứng được với các xử lý hiện tại hay không. Để ứng dụng của chúng ta đang chạy trên EC2 đó không bị gián đoạn thì việc nhận các cảnh báo khi dung lượng lưu trữ sắp đầy hay dung lượng ram luôn ở ngưỡng tối đa trong một thời gian dài để từ đó có những điều chỉnh, thay đổi tài nguyên cho EC2 cũng là một yêu cầu thiết thực.
Ở bài viết lần này mình sẽ giới thiệu và hướng dẫn cách cài đặt các công cụ để theo dõi và cảnh báo về dung lượng lưu trữ trên Amazon EC2.
1. Cloudwatch

Cloudwatch là một dịch vụ giám sát các nguồn tài nguyên cloud và ứng dụng chạy trên AWS. Nó giúp chúng ta thu thập và theo dõi các số liệu hệ thống, từ đó có thể đưa ra các thống kê và cho phép cài đặt các cảnh báo theo từng số liệu cụ thể.
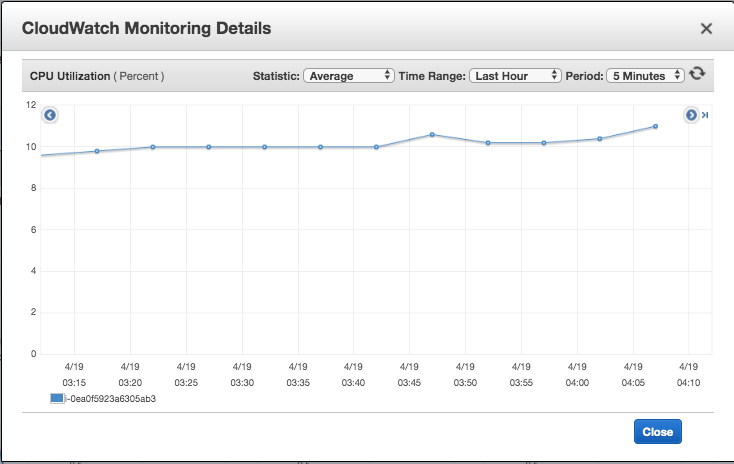
2. Metric
Metric là một biểu đồ theo dõi và biểu thị một tài nguyên nào đó của máy chủ đang sữ dụng ví dụ như: tài nguyên CPU, RAM, Disk...

- CPUCreditBalance
- CPUCreditUsage
- CPUUtilization
- DiskReadBytes
- DiskReadOps
- DiskWriteBytes
- DiskWriteOps
- NetworkIn
- NetworkOut
- StatusCheckFailed
- StatusCheckFailed_Instance
- StatusCheckFailed_System
Mặc định khi cài đặt một máy chủ EC2, AWS cung cấp cho chúng ta 12 metric như hình và danh sách phía trên, các metric này cho phép chúng ta theo dõi tình trạng CPU, tốc độ đọc ghi của dĩa cứng, tốc độ mạng vào ra của máy chủ... Tuy nhiên, để theo dõi và cài đặt cảnh báo dung lượng lưu trữ trên EC2 thì chúng ta sẽ cần phải cài đặt thêm các metric mở rộng.
Hiện tại, theo mình được biết thì chúng ta có thể thêm các metric mở rộng để theo dõi tình trạng sữ dụng đĩa cứng, ram như sau:
- DiskSpaceAvailable
- DiskSpaceUsed
- DiskSpaceUtilization
- MemoryAvailable
- MemoryUsed
- MemoryUtilization
- SwapUsed
- SwapUtilization
3. Cài đặt
I. Perl modules
Ở một số phiên bản linux, chúng ta phải cài đặt thêm Perl modules để có thể sử dụng chức năng báo cáo các số liệu sử dụng bộ nhớ, trao đổi và dung lượng ổ đĩa cho một phiên bản Linux.
Trước hết bạn cần ssh vào EC2 mà mình đang cần cài đặt với quyền sudo.
Đối với EC2 đang là Amazon Linux 2 và Amazon Linux AMI
sudo yum install -y perl-Switch perl-DateTime perl-Sys-Syslog perl-LWP-Protocol-https perl-Digest-SHA.x86_64
Đối với EC2 đang là Ubuntu
sudo apt-get update
sudo apt-get install unzip
sudo apt-get install libwww-perl libdatetime-perl
Nếu OS đang sử dụng cho EC2 không phải là 2 trường hợp trên thì chúng ta có thể theo dõi lệnh cài đặt cho các trường hợp khác tại đây.
II. CloudWatch Monitoring Scripts
Kết hợp với Perl modules ở trên để có thể trình bay cho chúng ta xem các số liệu thống kê cũng như gửi các số liệu đó theo format chuẩn cho CloudWatch.
Trước hết tạo một thư mục mới hoặc cd vào thư mục mà bạn muốn chứa các file cài đặt. sau đó download CloudWatch Monitoring Scripts và giải nén nó bằng lệnh:
curl https://aws-cloudwatch.s3.amazonaws.com/downloads/CloudWatchMonitoringScripts-1.2.2.zip -O
unzip CloudWatchMonitoringScripts-1.2.2.zip && \
rm CloudWatchMonitoringScripts-1.2.2.zip && \
cd aws-scripts-mon
![]()
Trong thư mục aws-scripts-mon vừa giải nén ra chúng ta sẽ thấy có 6 file như hình trên, ý nghĩa, chức năng của các file này là:
- CloudWatchClient.pm - Kết hợp cùng Perl modules giúp đơn giản hóa việc gọi Amazon CloudWatch từ các tập lệnh khác.
- mon-put-instance-data.pl - Thu thập số liệu hệ thống trên phiên bản Amazon EC2 (bộ nhớ, trao đổi, sử dụng không gian đĩa) và gửi chúng đến Amazon CloudWatch.
- mon-get-instance-stats.pl - Truy vấn Amazon CloudWatch và hiển thị số liệu thống kê sử dụng gần đây nhất cho phiên bản EC2 mà tập lệnh này được thực thi.
- awscreds.template - Mẫu tệp cho thông tin xác thực AWS lưu trữ ID khóa truy cập và khóa truy cập bí mật của bạn.
- LICENSE.txt - Tệp văn bản chứa giấy phép Apache 2.0.
- NOTICE.txt - Thông tin bản quyền.
4. Sử dụng
Chúng ta chạy lệnh sau để kiểm tra các thông số tài nguyên đĩa cứng ngay:
./mon-put-instance-data.pl --disk-space-util --disk-space-used --disk-space-avail --disk-path=/data --verify --verbose
Trong đó các option:
- --disk-space-util: Dung lượng đĩa cứng đã sữ dụng (tỷ lệ %)
- --disk-space-used: Dung lượng đĩa cứng đã sữ dụng (GB)
- --disk-space-avail: Dung lượng đĩa cứng có thể sử dụng (GB)
- --disk-path=/data: Đường dẫn đến thư mục muốn theo dõi dung lượng.
Kết quả:
DiskSpaceUtilization [/data]: 13.6786702466 (Percent)
DiskSpaceUsed [/data]: 13.4469451904297 (Gigabytes)
DiskSpaceAvailable [/data]: 79.8433685302734 (Gigabytes)
Using AWS credentials file <./awscreds.conf>
No credential methods are specified. Trying default IAM role.
Using IAM role <xxx-xxx>
Endpoint: https://monitoring.ap-northeast-1.amazonaws.com
Payload: {"MetricData":[{"MetricName":"DiskSpaceUtilization","Timestamp":1587267694,"Unit":"Percent","Dimensions":[{"Value":"/dev/nvme1n1","Name":"Filesystem"},{"Name":"InstanceId","Value":"i-0ea0f5923a6305ab3"},{"Name":"MountPath","Value":"/data"}],"Value":13.6786702466},{"Value":13.4469451904297,"Dimensions":[{"Value":"/dev/nvme1n1","Name":"Filesystem"},{"Value":"i-0ea0f5923a6305ab3","Name":"InstanceId"},{"Name":"MountPath","Value":"/data"}],"Timestamp":1587267694,"MetricName":"DiskSpaceUsed","Unit":"Gigabytes"},{"Unit":"Gigabytes","MetricName":"DiskSpaceAvailable","Timestamp":1587267694,"Value":79.8433685302734,"Dimensions":[{"Value":"/dev/nvme1n1","Name":"Filesystem"},{"Name":"InstanceId","Value":"i-0ea0f5923a6305ab3"},{"Name":"MountPath","Value":"/data"}]}],"Namespace":"System/Linux","__type":"com.amazonaws.cloudwatch.v2010_08_01#PutMetricDataInput"}

Verification completed successfully. No actual metrics sent to CloudWatch.
Chúng ta có thể thấy dung lượng đĩa cứng đã sử dụng là gần 13.7% ~ 13.4GB, dung lượng còn lại là 79.8GB. Câu lệnh trên chỉ cho chúng ta xem tại thời điểm đó và không sent thông tin đó cho CloudWatch.
Ngoài ra chúng ta có thể sữ dụng thêm rất nhiều option khác để có thể theo dõi các thông tin hệ thống khác như RAM:
| Name | Option |
|---|---|
| --mem-util | Collects and sends the MemoryUtilization metrics in percentages. This metric counts memory allocated by applications and the operating system as used, and also includes cache and buffer memory as used if you specify the --mem-used-incl-cache-buff option. |
| --mem-used | Collects and sends the MemoryUsed metrics, reported in megabytes. This metric counts memory allocated by applications and the operating system as used, and also includes cache and buffer memory as used if you specify the --mem-used-incl-cache-buff option. |
| --mem-used-incl-cache-buff | If you include this option, memory currently used for cache and buffers is counted as "used" when the metrics are reported for --mem-util, --mem-used, and --mem-avail. |
| --mem-avail | Collects and sends the MemoryAvailable metrics, reported in megabytes. This metric counts memory allocated by applications and the operating system as used, and also includes cache and buffer memory as used if you specify the --mem-used-incl-cache-buff option. |
| --swap-util | Collects and sends SwapUtilization metrics, reported in percentages. |
| --swap-used | Collects and sends SwapUsed metrics, reported in megabytes. |
| --disk-path=PATH | Selects the disk on which to report. PATH can specify a mount point or any file located on a mount point for the filesystem that needs to be reported. For selecting multiple disks, specify a --disk-path=PATH for each one of them. To select a disk for the filesystems mounted on / and /home, use the following parameters: --disk-path=/ --disk-path=/home |
| --disk-space-util | Collects and sends the DiskSpaceUtilization metric for the selected disks. The metric is reported in percentages. Note that the disk utilization metrics calculated by this script differ from the values calculated by the df -k -l command. If you find the values from df -k -l more useful, you can change the calculations in the script. |
| --disk-space-used | Collects and sends the DiskSpaceUsed metric for the selected disks. The metric is reported by default in gigabytes. Due to reserved disk space in Linux operating systems, disk space used and disk space available might not accurately add up to the amount of total disk space. |
| --disk-space-avail | Collects and sends the DiskSpaceAvailable metric for the selected disks. The metric is reported in gigabytes. Due to reserved disk space in the Linux operating systems, disk space used and disk space available might not accurately add up to the amount of total disk space. |
| --memory-units=UNITS | Specifies units in which to report memory usage. If not specified, memory is reported in megabytes. UNITS may be one of the following: bytes, kilobytes, megabytes, gigabytes. |
| --disk-space-units=UNITS | Specifies units in which to report disk space usage. If not specified, disk space is reported in gigabytes. UNITS may be one of the following: bytes, kilobytes, megabytes, gigabytes. |
| --aws-credential- file=PATH | Provides the location of the file containing AWS credentials. This parameter cannot be used with the --aws-access-key-id and --aws-secret-key parameters. |
| --aws-access-key-id=VALUE | Specifies the AWS access key ID to use to identify the caller. Must be used together with the --aws-secret-key option. Do not use this option with the --aws-credential-file parameter. |
| --aws-secret-key=VALUE | Specifies the AWS secret access key to use to sign the request to CloudWatch. Must be used together with the --aws-access-key-id option. Do not use this option with --aws-credential-file parameter. |
| --aws-iam-role=VALUE | Specifies the IAM role used to provide AWS credentials. The value =VALUE is required. If no credentials are specified, the default IAM role associated with the EC2 instance is applied. Only one IAM role can be used. If no IAM roles are found, or if more than one IAM role is found, the script will return an error. Do not use this option with the --aws-credential-file, --aws-access-key-id, or --aws-secret-key parameters. |
| --aggregated[=only] | Adds aggregated metrics for instance type, AMI ID, and overall for the Region. The value =only is optional; if specified, the script reports only aggregated metrics. |
| --auto-scaling[=only] | Adds aggregated metrics for the Auto Scaling group. The value =only is optional; if specified, the script reports only Auto Scaling metrics. The IAM policy associated with the IAM account or role using the scripts need to have permissions to call the EC2 action DescribeTags. |
| --verify | Performs a test run of the script that collects the metrics, prepares a complete HTTP request, but does not actually call CloudWatch to report the data. This option also checks that credentials are provided. When run in verbose mode, this option outputs the metrics that will be sent to CloudWatch. |
| --from-cron | Use this option when calling the script from cron. When this option is used, all diagnostic output is suppressed, but error messages are sent to the local system log of the user account. |
| --verbose | Displays detailed information about what the script is doing. |
| --helpx | Displays usage information. |
| --version | Displays the version number of the script. |
Bài viết tiếp theo mình sẽ tiếp tục hướng dẫn cách config để gửi các thông tin hệ thống đó lên CloudWatch và cài đặt Alarm để cảnh báo khi các thông số đó thoả mãn một điều kiện nào đó. Cảm ơn mọi người đã xem bài viết của mình.
Tài liệu tham khảo: https://docs.aws.amazon.com/AWSEC2/latest/UserGuide/mon-scripts.html
All rights reserved
