Dựng biểu đồ từ Google sheets
Bài đăng này đã không được cập nhật trong 4 năm
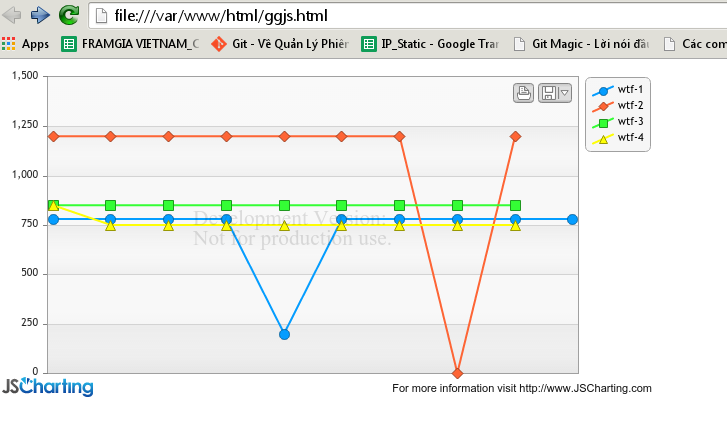
Có bao giờ bạn muốn fetch dữ liệu từ Google Sheet và sử dụng nó để làm 1 việc gì đó không? Trong bài này mình giới thiệu cách sử dụng dữ liệu từ Google Spreadsheets để tạo biểu đồ, sử dụng JsCharting. Đại loại là giống như thế này chẳng hạn:
Chuẩn bị Google sheet
Ở đây tớ đã có sẵn một sheet dữ liệu. Để tạo được một sheet như thế này, bạn cần:
- Nhập dữ liệu vào, đó là điều đương nhiên.
- Chọn view (xem) > Freeze (Cố định) > 1 row (1 hàng) => điều này để làm cái header cho bảng tính, có chữ WTF-1 2 3 4 như trên kia kìa.
- Sau đấy thì chọn File (Tệp) > Publish (Xuất bản lên web...). Thế là đã có dữ liệu cần dùng.

Lấy dữ liệu
Bây giờ thì lấy dữ liệu từ bảng tính, địa chỉ của bảng tính khi được xuất bản là https://docs.google.com/spreadsheets/d/1lGf_rGHszPSayedH4REet7hskFrzePlyFhwt5GwuI60/pubhtml thì lấy dữ liệu kiểu json của nó thì ta dùng cái này https://spreadsheets.google.com/feeds/list/1lGf_rGHszPSayedH4REet7hskFrzePlyFhwt5GwuI60/od6/public/basic?alt=json
Thêm Jquery vào:
<script type="text/javascript" src="http://cdnjs.cloudflare.com/ajax/libs/jquery/2.1.3/jquery.min.js"></script>
Đoạn script lấy dữ liệu, dùng getJSON:
$.getJSON("https://spreadsheets.google.com/feeds/list/1lGf_rGHszPSayedH4REet7hskFrzePlyFhwt5GwuI60/od6/public/basic?alt=json", function(data) {
    console.log(data);
}
Ta được thế này:
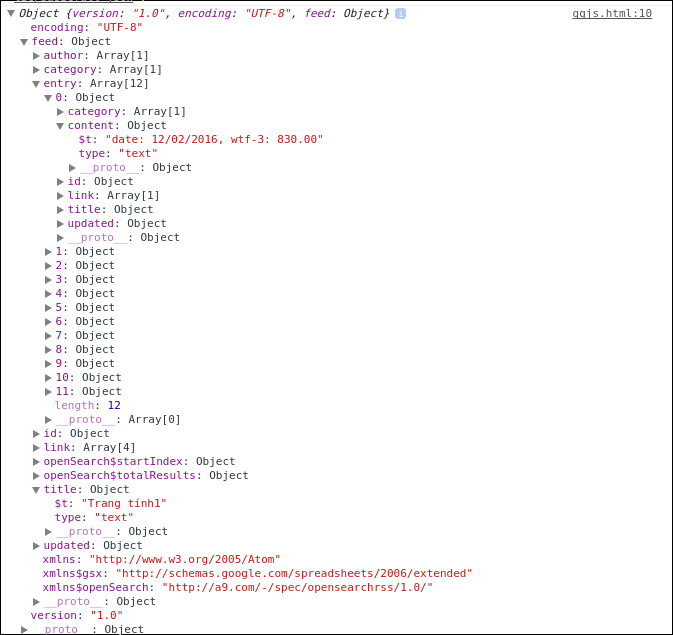
Cái chúng ta cần sử dụng là các thông tin nằm trong property $t. Giờ đến công đoạn xử lý dữ liệu.
Phân tích các dữ liệu
Thêm đoạn code vào html:
<pre id="output"></pre>
Trong Javascript:
$.getJSON("https://spreadsheets.google.com/feeds/list/1lGf_rGHszPSayedH4REet7hskFrzePlyFhwt5GwuI60/od6/public/basic?alt=json", function(data) {
    console.log(data);
    var seriesData = dataToSeries(data, 'date');
    $('#output').html(JSON.stringify(seriesData,null,2))
});

function dataToSeries(data, xValues) {
    var seriesObjects = {};
    var entry = data.feed.entry;
    $.each(entry, function(index) {
        processRow(entry[index].content.$t);
    });
    console.log(seriesObjects);

    var series = [];
    $.each(seriesObjects, function(name) {
        series.push($.extend(seriesObjects[name], {
            name: name
        }));
    });

    series.sort(function(a, b) {
        a = a.name;
        b = b.name;
        if (a < b) {
            return -1;
        }
        if (a > b) {
            return 1;
        }
        return 0;
    });
    return series;

    function processRow(row) {
        var date, kvpArr = rowToKvp(row);
        $.each(kvpArr, function(i) {
            var kvp = kvpArr[i];
            if (kvp[0] === xValues.toLowerCase()) {
                date = kvp[1];
            } else {
                addPointToSeries(date, kvp);
            }
        });
    }

    function rowToKvp(row) {
        var result = [],
            columns = row.split(', ');

        $.each(columns, function(i) {
            var kvp = columns[i].split(': ');
            result[i] = kvp;
        });

        return result;
    }

    function addPointToSeries(date, kvp) {
        var seriesName = kvp[0];
        addToSeries({
            x: date,
            y: parseFloat(kvp[1])
        });

        function addToSeries(point) {
            var series;
            if (!(series = seriesObjects[seriesName])) {
                series = seriesObjects[seriesName] = {
                    points: []
                };
            }
            series.points.push(point);
        }
    }
}
Đoạn script trên sẽ chuyển object thu được thành 1 mảng đầu vào cho JsCharting:
[
  {
    "points": [
      {
        "x": "19/02/2016",
        "y": 730
      },
      ...,
      ...,
      {
        "x": "27/02/2016",
        "y": 730
      },
      {
        "x": "28/02/2016",
        "y": 730
      }
    ],
    "name": "wtf-1"
  },
  {
    "points": [
      {
        "x": "21/02/2016",
        "y": 1320
      },
      ...,
      ...,
      {
        "x": "29/02/2016",
        "y": 1320
      }
    ],
    "name": "wtf-2"
  },
  {
    "points": [
      {
        "x": "12/02/2016",
        "y": 830
      },
      ...,
      ...,
      {
        "x": "28/02/2016",
        "y": 820
      },
      {
        "x": "29/02/2016",
        "y": 820
      }
    ],
    "name": "wtf-3"
  },
  {
    "points": [
      {
        "x": "22/02/2016",
        "y": 720
      },
      ...,
      ...,
      {
        "x": "28/02/2016",
        "y": 720
      },
      {
        "x": "29/02/2016",
        "y": 720
      }
    ],
    "name": "wtf-4"
  }
]
# Đoạn js trên mình đọc cũng hơi khó hiểu, do đó mình có viết lại đoạn code lấy dữ liệu bằng PHP, cho bạn nào không thích dùng JS hoặc đọc cũng chậm hiểu như mình 
    public function getData($url)
    {
        $getContent = file_get_contents($url);
        $content = json_decode($getContent);
        $data = $content->feed->entry;

        $tmpData1 = [];
        foreach ($data as $value) {
            $tmpData1[] = get_object_vars($value->content)['$t'];
        }

        $tmpData2 = [];
        foreach ($tmpData1 as $key => $value) {
            $tmpData2[] = explode(', ', $value);
        }

        $tmpData3 = [];
        foreach ($tmpData2 as $value) {
            foreach ($value as $value2) {
                $i = explode(': ', $value2);
                if ($i[0] == 'date') {
                    $thisDate = $i[1];
                }
                if ($i[0] != 'date') {
                    $tmpData3[$i[0]][] = [
                        'x' => $thisDate,
                        'y' => $i[1],
                    ];
                }
            }
        }

        $lastData = [];
        foreach ($tmpData3 as $key => $value) {
            $lastData[] = [
                'points' => $value,
                'name' => $key,
            ];
        }

        return $lastData;
    }
Với $url là https://spreadsheets.google.com/feeds/list/1lGf_rGHszPSayedH4REet7hskFrzePlyFhwt5GwuI60/od6/public/basic?alt=json
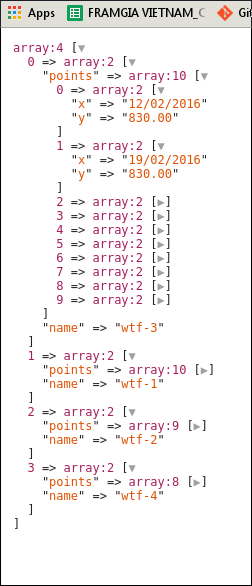
Thu được mảng tuơng tự:
Tạo biểu đồ
Đến công đoạn cuối cùng, thêm thư viện JsCharting và html vào:
<script type="text/javascript" src="https://jscharting.com/jsc/jscharting.js"></script>
<div id="mainChart"></div>
Thêm javascript:
$('#mainChart').JSC({
	xAxisScaleType: 'time',
	yAxisScaleRangeMin: 0,
	series: seriesData
});
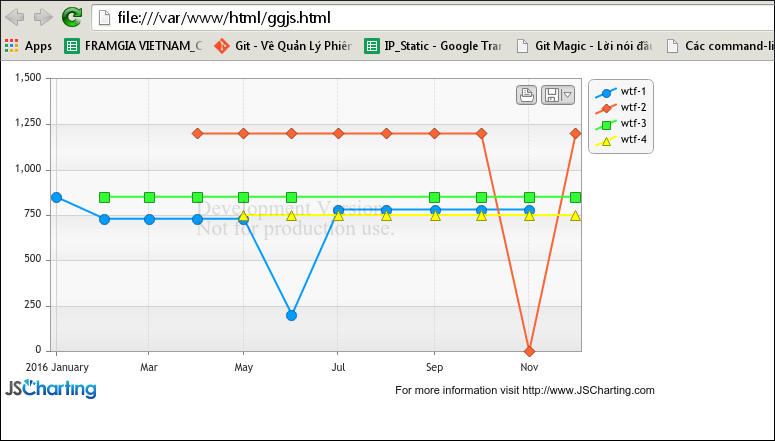
Và đây là kết quả:
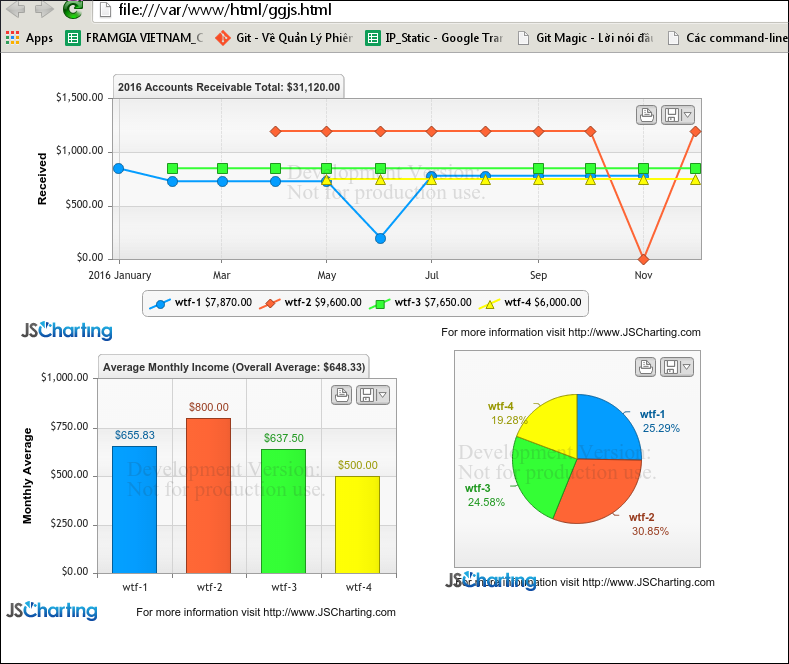
Thỏa sức vẽ biểu đồ với các thể loại mong muốn theo hướng dẫn của jsCharting
ví dụ:
    $('#mainChart').JSC({
        height: 280,
        xAxisScaleType: 'time',
        titleLabelText: '2016 Accounts Receivable Total: %sum',
        legendPosition: 'bottom',
        yAxis: {
            formatString: 'c',
            labelText: 'Received',
            scaleRangeMin: 0
        },
        legendDefaultEntryText: '<b>%name</b> %sum',
        series: seriesData
    }, function(chart) {
        var seriesObjects = chart.getSeries();
        var newSeries = {
            palette: 'default',
            points: []
        };
        $.each(seriesObjects, function(i) {
            var ser = seriesObjects[i];
            newSeries.points[i] = {
                name: ser.name,
                y: ser.tokenValue('%sum') / 12
            };
        });

        $('#avgChart').JSC({
            type: 'column',
            height: 280,
            titleLabelText: 'Average Monthly Income (Overall Average: %average)',
            legendVisible: false,
            yAxisFormatString: 'c',
            yAxisLabelText: 'Monthly Average',
            defaultPointLabelVisible: true,
            series: [newSeries]
        });

    });

    $('#pieChart').JSC({
        type: 'pie',
        height: 250,
        yAxisFormatString: 'c',
        defaultPointLabel: {
            text: '<b>%name</b><br/> %percentOfTotal%',
            offset: 3
        },
        defaultSeriesShapePadding: .4,
        series: seriesData
    });
Kết luận
All rights reserved