Deploy ứng dụng Machine learning lên Web server. Phần 5: Tạo Website với Codeigniter, AdminLTE
Bài đăng này đã không được cập nhật trong 7 năm
Sau khi các bạn thực hiện xong phần 2, 3 và phần 4 bước cuối cùng là làm thế nào để show dữ liệu cho người dùng, làm cách nào để có giao diện trực quan dành cho những người không chuyên về IT sử dụng. Bài viết này sẽ giải quyết vấn đề đó.
Demo
Website demo: http://tradersupport.club/admin
Chuẩn bị
Như đã giới thiệu từ đầu thì mình sẽ sử dụng các Framework có sẵn chứ không mất thời gian dựng lại từ đầu.
Cụ thể là mình sử dụng 2 bộ code sau:
- Backend: CodeIgniter: https://codeigniter.com/
- Frontend: AdminLTE: https://adminlte.io/
Mình có tìm trên github được source kết hợp cả 2 open source này, đã có sẵn một số chức năng cơ bản như login, phân quyền,...
Link tải: https://github.com/kishor10d/Admin-Panel-User-Management-using-CodeIgniter
Oke vậy là xong một số chức năng cơ bản mà ko phải mất công code chay từ đầu 
Xây dựng ứng dụng
Một bộ source code như trên đã khá đủ tuy nhiên thì các bạn cần custom lại cho phù hợp với cá nhân của mình. Ở đây mình cần lấy dữ liệu ra và show cho người dùng sử dụng.
Ở đây mình sẽ sử dụng bảng historical_price_predictions để show cho người dùng và dữ liệu sẽ được cập nhất mỗi giờ bằng crontab như ở phần 4.
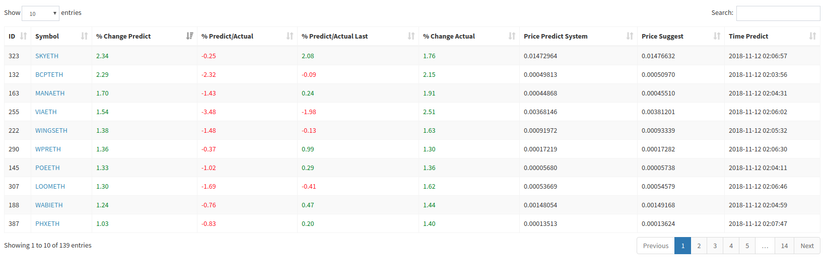
Data Table
Phần này sẽ show dữ liệu dạng bảng đưa ra đồng coin tốt nhất để mua và gợi ý giá bán/mua như sau:
Model: Historical_Price_Predictions_model.php
Lấy dữ liệu từ database qua query sau:
SELECT a.*, c.symbol
FROM (SELECT h.id_coin,
        ROUND(((price_preidct_last / price_predict_previous) - 1) * 100, 2) AS percent_predict,
        ROUND(((price_predict_previous / price_actual_last) - 1) * 100, 2) AS percent_predict_actual,
        ROUND(((price_preidct_last / price_actual_last) - 1) * 100, 2) AS percent_predict_actual_last,
        ROUND(((price_actual_last / price_actual_previous) - 1) * 100, 2) AS percent_actual,
        ROUND(price_preidct_last, 8) price_preidct_last,
        ROUND(price_preidct_last - (price_predict_previous - price_actual_last), 8) price_preidct_true
    FROM historical_price_predictions AS h
    WHERE time_create > UNIX_TIMESTAMP(NOW()) - 60 * 60
    ORDER BY percent_predict DESC
    ) AS a
JOIN coin_info c ON a.id_coin = c.id
Ở đây mình lấy dữ liệu ra và có tính toán 1 số điều kiện cơ bản mà theo cá nhân mình nghĩ là nó tốt. Nếu có công thức nào hay hơn thì hãy comment góp ý ở dưới nhé.
Giải thích qua 1 chút:
price_preidct_truelà giá mà mình gợi ý giá sẽ tới mức giá này trong khung giờ tiếp theo.price_preidct_lastlà giá hệ thống dự đoán trong giờ tiếp theo.time_create > UNIX_TIMESTAMP(NOW()) - 60 * 60là điều kiện lấy ra 1 row dự đoán trong khung giờ hiện tại thông thường thì mình chạy model predict mất khoảng 5~7 phút nên phần này có thể coi là chấp nhận được.- Các chỉ số khác thì mọi người tìm hiểu nhé
Controller: Chart.php
Đổ lên view qua function sau:
    function showTablePredict()
    {
        $data['datatable'] = $this->Historical_Price_Predictions_model->getDataPredict();
        $this->global['pageTitle'] = "Predict price coin" ;
        $this->loadViews("dashboard", $this->global, $data, NULL);
    }
View: dashboard.php
Tạo data table:
<div class="box-body">
    <div id="example1_wrapper" class="dataTables_wrapper form-inline dt-bootstrap">
        <div class="row">
            <div class="col-sm-12">
                <table id="example1" class="table table-bordered table-striped dataTable" role="grid" aria-describedby="example1_info">
                    <thead>
                    <tr role="row">
                        <th class="" tabindex="0" aria-controls="example1" rowspan="1" colspan="1" style="width: 2%;">ID</th>
                        <th class="" tabindex="0" aria-controls="example1" rowspan="1" colspan="1" style="width: 5%px;">Symbol</th>
                        <th class="" tabindex="0" aria-controls="example1" rowspan="1" colspan="1" style="width: 10%px;">% Change Predict</th>
                        <th class="" tabindex="0" aria-controls="example1" rowspan="1" colspan="1" style="width: 10%px;">% Predict/Actual</th>
                        <th class="" tabindex="0" aria-controls="example1" rowspan="1" colspan="1" style="width: 10%px;" >% Predict/Actual Last</th>
                        <th class="" tabindex="0" aria-controls="example1" rowspan="1" colspan="1" style="width: 10%px;" >% Change Actual</th>
                        <th class="" tabindex="0" aria-controls="example1" rowspan="1" colspan="1" style="width: 10%px;" >Price Predict System</th>
                        <th class="" tabindex="0" aria-controls="example1" rowspan="1" colspan="1" style="width: 10%px;" >Price Suggest</th>
                        <th class="" tabindex="0" aria-controls="example1" rowspan="1" colspan="1" style="width: 10%px;" >Time Predict</th>
                    </tr>
                    </thead>
                    <tbody>
                    <?php foreach ($datatable as $item){
                        echo '<tr role="row" class="odd">';
                        echo '<td class="">' . $item->id_coin . '</td>';
                        echo '<td class=""> <a href="' . base_url() . 'chart/' . $item->symbol . '" ><span>' . $item->symbol . '</span></a></td>';
                        echo '<td class="">' . $item->percent_predict . '</td>';
                        echo '<td class="">' . $item->percent_predict_actual . '</td>';
                        echo '<td class="">' . $item->percent_predict_actual_last . '</td>';
                        echo '<td class="">' . $item->percent_actual . '</td>';
                        echo '<td class="">' . $item->price_preidct_last . '</td>';
                        echo '<td class="">' . $item->price_preidct_true . '</td>';
                        echo '<td class="">' . $item->time_predict . '</td>';

                    } ?>
                    </tr>
                    </tbody>
                </table>
            </div>
        </div>
    </div>
</div>
Đổ dữ liệu lên table:
<!-- DataTables -->
<script src="<?php echo base_url(); ?>/assets/bower_components/datatables.net/js/jquery.dataTables.min.js"></script>
<script src="<?php echo base_url(); ?>/assets/bower_components/datatables.net-bs/js/dataTables.bootstrap.min.js"></script>
<script>
    $(function () {
        $('#example1').DataTable( {
            "order": [[ 2, "desc" ]],
            columnDefs: [{targets: [2,3,4,5],
                render: function ( data, type, row ) {
                    var color = 'black';
                    if (data > 0) {
                        color = 'green';
                    }
                    if (data < 0) {
                        color = 'red';
                    }
                    return '<span style="color:' + color + '">' + data + '</span>';
                }
            }]
        })
    })
</script>
Oke vậy là xong phần data table rồi
Chart
Phần này show ra cho người dùng xem dữ liệu dự đoán dạng biểu đồ nhằm trực quan hóa, thông thường đối với con người sẽ thu nhận thông tin từ hình ảnh, biểu đồ hơn là các con số.
Model: Historical_Price_Predictions_model.php
Để lấy dữ liệu ra thì mình lấy dữ liệu qua query sau:
SELECT 	REPLACE(REPLACE(h.price_actual,"[",""),"]","") price_actual,
    REPLACE(REPLACE(h.price_predict,"[",""),"]","") price_predict,
    c.symbol,
    ht.openTime_last
FROM historical_price_predictions h
JOIN coin_info c ON h.id_coin = c.id
    AND c.symbol = ?
JOIN (SELECT id_coin,
        MAX(openTime_last) openTime_last
      FROM historical_train
      GROUP BY id_coin) AS ht
ON ht.id_coin = c.id
ORDER BY h.id DESC
LIMIT 1
Giải thích một chút:
openTime_lastlà giá mở cửa mà mình đã lấy dữ liệu để train model ở phần trước mỗi lần train thì mình đều lưu lại hết.
Controller: Chart.php
Phần này cần xử lý 1 chút đó là dữ liệu mình lưu dạng text nên cần từ text split để đổ lên chart được. Đồng thời mình cũng gọi API để lấy giá của đồng coin hiện tại.
function showChart($symbol = "ZECETH")
{
    $this->load->library("rest");
    $result = $this->rest->get("https://api.binance.com/api/v3/ticker/price?symbol=" . $symbol);
    $data = $this->Historical_Price_Predictions_model->getDataForChartCoin($symbol);
    $data->price_actual = explode(",", $data->price_actual);
    $data->price_predict = explode(",", $data->price_predict);
    $data->price = $result->price;
    $data->symbol = $symbol;
    $this->global['pageTitle'] = "Chart " . $symbol;
    $this->loadViews("chart", $this->global, $data, NULL);
}
View: chart.php Mình sẽ dùng chart dạng Line
Tạo chart:
<section class="content">
    <div class="row">
        <div class="col-xs-12">
            <div class="box box-primary">
                <div class="box-header with-border">
                    <h3 class="box-title">Price: <?php echo $price;?></h3>

                    <div class="box-tools pull-right">
                        <button type="button" class="btn btn-box-tool" data-widget="collapse"><i class="fa fa-minus"></i>
                        </button>
                        <button type="button" class="btn btn-box-tool" data-widget="remove"><i class="fa fa-times"></i></button>
                    </div>
                </div>
                <div class="box-body chart-responsive">
                    <div class="chart" id="line-chart" style="height: 500px;">
                    </div>
                </div>
                <!-- /.box-body -->
            </div>
        </div>
    </div>
</section>
Đổ dữ liệu lên chart:
<!-- Morris.js charts -->
<script src="<?php echo base_url(); ?>assets/bower_components/raphael/raphael.min.js"></script>
<script src="<?php echo base_url(); ?>assets/bower_components/morris.js/morris.min.js"></script>
<!-- FastClick -->
<script src="<?php echo base_url(); ?>assets/bower_components/fastclick/lib/fastclick.js"></script>
<script>
    $(function () {
        "use strict";
        var line = new Morris.Line({
            element: 'line-chart',
            resize: true,
            data: [
                <?php $len = count($price_actual);
                for($i = 0; $i< $len ; $i++){
                    $time = (($i+1) * 60 * 60 * 1000 + $openTime_last);
                    echo  '{y: '. $time . ', price_actual: '. $price_actual[$i] . ', price_predict: ' . $price_predict[$i] . '},';
                }
                ?>
            ],
            xkey: 'y',
            ykeys: ['price_actual', 'price_predict'],
            ymin: 'auto',
            labels: ['Actual', 'Predict'],
            lineColors: ['#a0d0e0', '#f45f42'],
            hideHover: 'auto'
        });
    });
</script>
Và kết quả là:

Deploy lên server
Sau khi các bạn thực hiện các bước trong phần 2: Tạo Web server, MySQL với Google Cloud Platform các bạn chỉ cần đẩy code lên thư mục /var/www/html và cấu hình database tại config/database.php
Ví dụ mình có đẩy code lên github: https://github.com/hung96ad/Admin-Panel-User-Management-using-CodeIgniter
Trên server chạy lệnh sau:
git clone https://github.com/hung96ad/Admin-Panel-User-Management-using-CodeIgniter admin
Cấu hình DB:
	'hostname' => 'ip_mysql_server',
	'username' => 'your_username',
	'password' => 'your_password',
	'database' => 'coin',
Nhớ chạy query tạo bảng là file cias.sql trước nhé
Test thử code xem:
http://your_ip/admin
http://your_domain/admin
Demo của mình: http://tradersupport.club/admin
Source
- Code sample của mình: https://github.com/hung96ad/Admin-Panel-User-Management-using-CodeIgniter
- Admin-Panel-User-Management-using-CodeIgniter: https://github.com/kishor10d/Admin-Panel-User-Management-using-CodeIgniter
- CodeIgniter: https://github.com/bcit-ci/CodeIgniter
- AdminLTE: https://adminlte.io/
All rights reserved
