Creating Charts With Laravel And Vuejs Chartjs
Bài đăng này đã không được cập nhật trong 7 năm
1. Giới thiệu
Trong quá trình làm phát triển. Chắc sớm muộn chúng ta cũng gặp phải một số tính năng liên qua đến việc vẽ đồ thị. Ví dụ như vẽ biểu đồ doanh thu bán hàng, biểu đồ số lượng đơn đặt hàng..v.v...
Hiện có rất nhiều thư viện javascript có sẵn hỗ trợ chúng ta làm việc này. Cụ thể, nay mình xin phép hướng dẫn ví dụ tạo đồ thị thống kê loại tiền BitCoin theo hàng năm với thư viện Chart.js kết hợp với Laravel và Vuejs.
Sau khi hoàn thành ví dụ ta được như sau
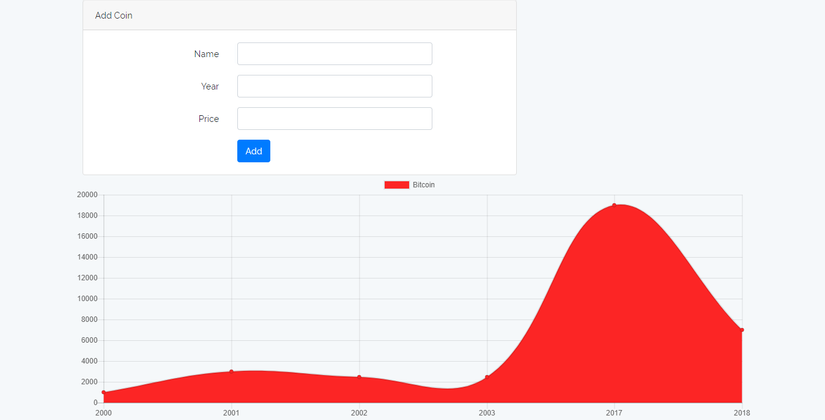
2. Bắt đầu ví dụ
2.1 Cài đặt project
Tạo project tên là laravelcharts
composer create-project laravel/laravel lavuecharts --prefer-dist
Cài đặt vuejs dependencies.
npm install
File webpack.mix.js trong thư mục gốc ta thêm đoạn code sau
// webpack.mix.js

let mix = require('laravel-mix');

mix.js('resources/assets/js/app.js', 'public/js')
   .sass('resources/assets/sass/app.scss', 'public/css');
Tệp webpack.mix.js biên dịch mã es6 và mã trình biên dịch mẫu vue thành vanilla js và chúng ta chỉ cần đưa tệp js được tạo vào dự án của chúng ta. Nếu bạn chưa từng làm việc với laravel mix, hãy xem bài viết này Laravel Mix For Compiling Assets Tutorial.
Bây giờ, điều tiếp theo là đi đến terminal và gõ lệnh sau để watch các file js và sass của chúng ta để biên dịch. Vì vậy, khi chúng tôi thay đổi mã vue.js, nó sẽ tự động biên dịch lại mã, vì vậy chúng ta không cần chạy bằng cơm để biên dịch lại mỗi lần thay đổi.
npm run watch
2.2 Tạo một component để hiển thị form
Đầu tiên, chúng ta cần thay đổi tệp welcome.blade.php và thêm thuộc tính id="app" vào div chính để chúng ta có bind vue instance với project của chúng ta.
<<!DOCTYPE html>
<html>
<head>
   <meta charset="utf-8" />
   <meta http-equiv="X-UA-Compatible" content="IE=edge">
   <title>Add Coin Details</title>
   <meta name="viewport" content="width=device-width, initial-scale=1">
   <link href="{{ asset('css/app.css') }}" rel="stylesheet" />
</head>
<body>
   <div class="container" id="app"></div>
   <script>
         window.Laravel = <?php echo json_encode([
             'csrfToken' => csrf_token(),
          ]); ?>
   </script>
   <script src="{{ asset('js/app.js') }}" type="text/javascript"></script>
</body>
</html>
Tiếp theo tạo một component AddCoin.vue trong resources/assets/js/components để có thể tạo ra một loại coin với các thông số: name, year, price (tên đồng coin, năm sản xuât, mệnh giá)
// AddComponent.vue

<template>
   <div class="col-md-8">
            <div class="card card-default">
                <div class="card-header">Add Coin</div>

                <div class="card-body">
                    <form @submit.prevent="addCoin">
                        <div class="form-group row">
                            <label for="name" class="col-sm-4 col-form-label text-md-right">Name</label>
                            <div class="col-md-6">
                                <input id="email" type="text" class="form-control" v-model="coin.name" required autofocus>
                            </div>
                        </div>

                        <div class="form-group row">
                            <label for="year" class="col-md-4 col-form-label text-md-right">Year</label>
                            <div class="col-md-6">
                                <input type="text" class="form-control" v-model="coin.year"  required>
                            </div>
                        </div>

                         <div class="form-group row">
                            <label for="year" class="col-md-4 col-form-label text-md-right">Price</label>
                            <div class="col-md-6">
                                <input type="text" class="form-control" v-model="coin.price"  required>
                            </div>
                        </div>

                        <div class="form-group row mb-0">
                            <div class="col-md-8 offset-md-4">
                                <button class="btn btn-primary">
                                    Add
                                </button>
                            </div>
                        </div>
                    </form>
                </div>
            </div>
        </div>
</template>

<script>
   export default {
      data() {
         return {
            coin: {}
         }
      },
      methods: {
         addCoin() {
            alert('submitted');
         }
      }
   }
</script>
Sau khi tạo xong component AddCoin.vue ta cần phải thêm nó vào file app.js
// app.js

require('./bootstrap');

window.Vue = require('vue');

Vue.component('coin-add-component', require('./components/AddComponent.vue'));

const app = new Vue({
    el: '#app'
});
Cuối cùng thêm compent ở trên vào file welcome.blade.php
<div class="container" id="app">
   <coin-add-component></coin-add-component>
</div>
2.3 Tạo controller, model, migration để xử lý việc lưu coin vào trong db
Gõ lệnh dưới đây để sinh ra file model, migration và controller
 php artisan make:model Coin -m
 php artisan make:controller CoinController
Nó tạo ra model, migration và controller. Trong file controller, viết hàm store lưu các chi tiết của các đồng tiền. Bây giờ tạo lược đồ cho bảng coin của chúng ta. Do đó trong file migration ta thêm đoạn code sau
// create_coins_table.php

public function up()
{
    Schema::create('coins', function (Blueprint $table) {
        $table->increments('id');
        $table->string('name');
        $table->integer('year');
        $table->integer('price');
        $table->timestamps();
    });
}
chạy lệnh sau để sinh ra bảng coin trong db
php artisan migrate
Trong funciton store của file controller thêm đoạn code logic xử lý lưu trữ coin
use App\Coin;

public function store(Request $request)
 {
        Coin::create($request->only('name', 'year', 'price'));

        return response()->json(['success' => 'Coin has been successfully added'], 200);
 }
trong web.php định nghĩa một route post
// web.php

Route::post('/coins', 'CoinController@store');
2.4 Gửi request post và lưu trữ coin
Trong bài viết này mình sử dụng axios để gửi request lên server, do vuejs có module vue-axios nên ta chỉ cần gõ sau để cài module này
npm install vue-axios --save-dev
Sử dụng module này trong file app.js
// app.js

import VueAxios from 'vue-axios';
import axios from 'axios';

require('./bootstrap');

window.Vue = require('vue');
Vue.use(VueAxios, axios);

Vue.component('coin-add-component', require('./components/AddComponent.vue'));

const app = new Vue({
    el: '#app'
});
Khi đó việc send request đến server trong vuejs ta làm như sau
// AddComponent.vue

export default {
      data() {
         return {
            coin: {}
         }
      },
      methods: {
         addCoin() {
            let uri = 'http://localhost:8000/coins';
            this.axios.post(uri, this.coin).then((response) => {
               window.location.reload();
            });
         }
      }
   }
2.5 Tạo một component để hiển thị biểu đồ
Chúng ta sẽ hiển thị biểu đồ Bitcoin theo hàng năm. Chúng tôi sẽ lấy dữ liệu Bitcoin từ cơ sở dữ liệu. Đối với điều đó, chúng ta cần định nghĩa route và viết truy vấn trong file controller.
// web.php
Route::get('/coins', 'CoinController@index');
// CoinController.php

public function index()
{
   $coins = Coin::where('name', 'Bitcoin')
                ->orderBy('year')
                ->get();
    return response()->json($coins);
}
Tạo một component ChartComponent trong folder component
<script>
import { Line } from 'vue-chartjs';

export default {
   extends: Line,
   mounted() {
         let uri = 'http://localhost:8000/coins';
         let Years = new Array();
         let Labels = new Array();
         let Prices = new Array();
         this.axios.get(uri).then((response) => {
            let data = response.data;
            if(data) {
               data.forEach(element => {
               Years.push(element.year);
               Labels.push(element.name);
               Prices.push(element.price);
               });
               this.renderChart({
               labels: Years,
               datasets: [{
                  label: 'Bitcoin',
                  backgroundColor: '#FC2525',
                  data: Prices
            }]
         }, {responsive: true, maintainAspectRatio: false})
       }
       else {
          console.log('No data');
       }
      });
   }
}
</script>
Để có thể hiện thị được biểu đồ, ta cần đăng ký nó đến file app.js và thêm vào file welcome.blade.php
// app.js

import VueAxios from 'vue-axios';
import axios from 'axios';

require('./bootstrap');

window.Vue = require('vue');
Vue.use(VueAxios, axios);

Vue.component('coin-add-component', require('./components/AddComponent.vue'));
Vue.component('chart-component', require('./components/ChartComponent.vue'));

const app = new Vue({
    el: '#app'
});
<!DOCTYPE html>
<html>
<head>
   <meta charset="utf-8" />
   <meta http-equiv="X-UA-Compatible" content="IE=edge">
   <title>Add Coin Details</title>
   <meta name="viewport" content="width=device-width, initial-scale=1">
   <link href="{{ asset('css/app.css') }}" rel="stylesheet" />
</head>
<body>
   <div class="container" id="app">
       <coin-add-component></coin-add-component>
       <chart-component></chart-component>
   </div>
   <script>
        window.Laravel = <?php echo json_encode([
            '_token' => csrf_token(),
        ]); ?>
    </script>
   <script src="{{ asset('js/app.js') }}" type="text/javascript"></script>
</body>
</html>
3 Kết luận
Biểu đồ làm cho chúng ta nhìn giữ liệu thống kê một cách trực quan hơn, như ví dụ trên mình chỉ sử dụng loại biểu đồ line, ngoài ra Chartjs còn cung cấp cho chúng ta rất nhiều loại biểu đồ khác nhau, các bạn có thể tham khảo doc của Chartjs
4 Tài liệu tham khảo
https://appdividend.com/2018/02/23/laravel-vue-js-chartjs-tutorial-example/
All rights reserved
