Cách vẽ các loại biểu đồ trong Wicket Framework
Bài đăng này đã không được cập nhật trong 4 năm
Vẽ chart trong dự án wicket
Trong các dự án liên quan đến wicket framework, đôi khi cần phải vẽ các loại biểu đồ, bạn có thể dùng các dùng các thư viện sau JFreeChart, wicked-charts ...
Trong bài viết này mình xin giới thiệu về wicked-charts, thư viện này được xây dựng dựa trên thư viện Highcharts nổi tiếng. Về nguyên tắc thư viện này sẽ dùng code java để tạo ra đoạn mã javascript của highcharts nhúng vào html để vẽ chart.
Thư viện hiện tại đang hỗ trợ đến wicket 6.4.0, bạn có thể vẽ được các loại chart sau
- LINE AND SCATTER CHARTS
Basic Line Ajax loaded data, clickable points With data labels Time series, zoomable Spline with inverted axes Spline with symbols Spline with plot bands Time data with irregular intervals Logarithmic axis Scatter plot - AREA CHARTS
Basic Area Area with negative values Stacked area Percentage area Area with missing points Inverted axes Area-spline - COLUMN AND BAR CHARTS
Basic bar Stacked bar Bar with negative stack Basic column Column with negative values Stacked column Stacked and grouped column Stacked percentage column Column with rotated labels Column with drilldown Data defined in a HTML table - PIE CHARTS
Pie chart Pie with gradient fill Donut chart Pie with legend DYNAMIC CHARTS Spline updating each second Click to add a point Master-detail chart - COMBINATIONS
Column, Line and Pie Dual axes, line and column Multiple axes Scatter with regression line MORE CHART TYPES Angular gauge Clock Gauge with dual axes VU meter Area range Column range Polar chart Spiderweb Wind rose Bubble Chart
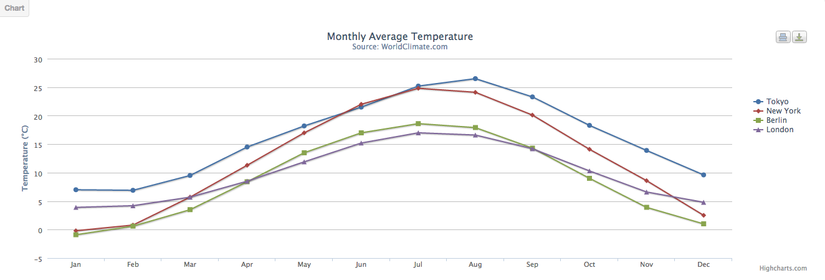
Mình xin giới thiệu sơ qua về chart kiểu Basic Line
1.Trong file html
<!-- HTML code -->
<div wicket:id="chart"/>
2.Trong file java wicket page
Options options = new BasicLineOptions();
options.setTitle(new Title("My Chart"));
add(new Chart("chart", options));
File BasicLineOptions.java
import java.util.Arrays;
import java.util.Collections;

import com.googlecode.wickedcharts.highcharts.options.Axis;
import com.googlecode.wickedcharts.highcharts.options.ChartOptions;
import com.googlecode.wickedcharts.highcharts.options.HorizontalAlignment;
import com.googlecode.wickedcharts.highcharts.options.Legend;
import com.googlecode.wickedcharts.highcharts.options.LegendLayout;
import com.googlecode.wickedcharts.highcharts.options.PlotLine;
import com.googlecode.wickedcharts.highcharts.options.SeriesType;
import com.googlecode.wickedcharts.highcharts.options.Title;
import com.googlecode.wickedcharts.highcharts.options.VerticalAlignment;
import com.googlecode.wickedcharts.highcharts.options.color.HexColor;
import com.googlecode.wickedcharts.highcharts.options.series.Series;
import com.googlecode.wickedcharts.highcharts.options.series.SimpleSeries;
import com.googlecode.wickedcharts.showcase.options.base.ShowcaseOptions;

public class BasicLineOptions extends ShowcaseOptions {

  private static final long serialVersionUID = 1L;

  public BasicLineOptions() {
    ChartOptions chartOptions = new ChartOptions();
    chartOptions
        .setType(SeriesType.LINE);
    chartOptions
        .setMarginRight(130);
    chartOptions
        .setMarginBottom(25);
    setChartOptions(chartOptions);

    Title title = new Title("Monthly Average Temperature");
    title
        .setX(-20);
    setTitle(title);

    Title subTitle = new Title("Source: WorldClimate.com");
    subTitle
        .setX(-20);
    setSubtitle(subTitle);

    Axis xAxis = new Axis();
    xAxis
        .setCategories(Arrays
            .asList(new String[] { "Jan", "Feb", "Mar", "Apr", "May", "Jun",
                "Jul", "Aug", "Sep", "Oct", "Nov", "Dec" }));
    setxAxis(xAxis);

    PlotLine plotLines = new PlotLine();
    plotLines
        .setValue(0f);
    plotLines
        .setWidth(1);
    plotLines
        .setColor(new HexColor("#999999"));

    Axis yAxis = new Axis();
    yAxis
        .setTitle(new Title("Temperature (°C)"));
    yAxis
        .setPlotLines(Collections
            .singletonList(plotLines));
    setyAxis(yAxis);

    Legend legend = new Legend();
    legend
        .setLayout(LegendLayout.VERTICAL);
    legend
        .setAlign(HorizontalAlignment.RIGHT);
    legend
        .setVerticalAlign(VerticalAlignment.TOP);
    legend
        .setX(-10);
    legend
        .setY(100);
    legend
        .setBorderWidth(0);
    setLegend(legend);

    Series<Number> series1 = new SimpleSeries();
    series1
        .setName("Tokyo");
    series1
        .setData(Arrays
            .asList(new Number[] { 7.0, 6.9, 9.5, 14.5, 18.2, 21.5, 25.2, 26.5,
                23.3, 18.3, 13.9, 9.6 }));
    addSeries(series1);

    Series<Number> series2 = new SimpleSeries();
    series2
        .setName("New York");
    series2
        .setData(Arrays
            .asList(new Number[] { -0.2, 0.8, 5.7, 11.3, 17.0, 22.0, 24.8,
                24.1, 20.1, 14.1, 8.6, 2.5 }));
    addSeries(series2);

    Series<Number> series3 = new SimpleSeries();
    series3
        .setName("Berlin");
    series3
        .setData(Arrays
            .asList(new Number[] { -0.9, 0.6, 3.5, 8.4, 13.5, 17.0, 18.6, 17.9,
                14.3, 9.0, 3.9, 1.0 }));
    addSeries(series3);

    Series<Number> series4 = new SimpleSeries();
    series4
        .setName("London");
    series4
        .setData(Arrays
            .asList(new Number[] { 3.9, 4.2, 5.7, 8.5, 11.9, 15.2, 17.0, 16.6,
                14.2, 10.3, 6.6, 4.8 }));
    addSeries(series4);

  }

  @Override
  public String getLabel() {
    return "Basic line";
  }
}
Kết quả khi thực thi:
3.Các tuỳ chọn
3.1 Tuỳ chọn liên quan đến nút export và print:
Bạn sử dụng class ExportingOptions để tinh chỉnh tuỳ chọn
ví dụ muốn ẩn mấy cái nút đó đi.
setExporting(new ExportingOptions().setEnabled(false));
3.2 Tuỳ chọn liên quan đến credit, trên chart mặc định sẽ sinh ra ở dưới footer sẽ có chữ Highcharts.com -> Khi click vào đây sẽ di chuyển đến trang Highcharts
Ví dụ muốn ẩn nó đi bạn thêm dòng code này vào
setCredits(new CreditOptions().setEnabled(false));
Có rất nhiều tuỳ chọn khác ... Theo kinh nghiệm của mình khi muốn chỉnh sửa gì chart bạn cứ tìm hiểu theo highchart trước, khi biết thuộc tính cần chỉnh sửa là gì rùi thì vào trong wicked-chart tìm class tương ứng rùi tiến hành chỉnh sửa. Vì như thế mình hiểu được các khái niệm định nghĩa vị trí item trong highcharts rùi.
Rất đơn giản bạn sẽ ứng dụng được vẽ biểu đồ trong dự án của mình.
All rights reserved
