LLDB Debugger
Bài đăng này đã không được cập nhật trong 2 năm

If you don't know what means LLDB abbreviation, then this post is for you!
I am quite serious. This tool makes life much easier when you publish your iOS applications.
Honestly, how many times you had to write NSLog or print to debug some variable? How many times you had to recompile application to check new parameters? Or have you changed color of UIView just for debugging?

That with this tool without writing additional lines in the code you can do this:
- Print the parameters
- Change parameters value
- Change UI parameters value
- Create new parameters
- Execute different pieces of code for Debug and Release
So, are you interested? Then let's begin!!!

What is LLDB?
LLDB is a next generation, high-performance debugger. It is built as a set of reusable components which highly leverage existing libraries in the larger LLVM Project, such as the Clang expression parser and LLVM disassembler. LLDB is the default debugger in Xcode on Mac OS X and supports debugging C, Objective-C and C++ on the desktop and iOS devices and simulator.
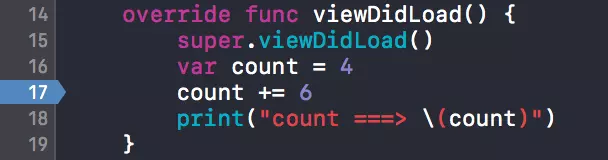
Create a simple application, in order to put a breakpoint inside viewDidLoad() method, click on the beginning of the line.
Now run the application, and you will see the following:
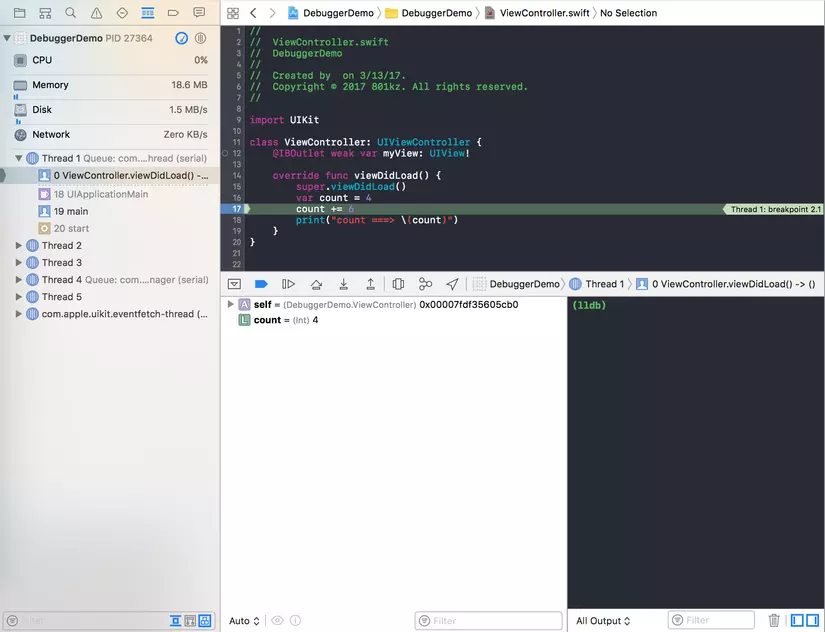
The application stopped on the breakpoint line. There is LLDB console on the lower right corner of the window. There are visualized parameters of the controller to the left of the LLDB console. The leftmost column is the navigator, where you can see all threads and working processes of application. However all attention of toda's post is be given exclusively to LLDB console. LLDB is a today's star!
Commands
There are three most important commands, which you need to know to work with LLDB successfully: print, expression and print object
These commands are just variants of expression command with different flags, but it doesn't matter for now.
print is used to display parameter's values and it creates a new parameter with printed value.
Example:
(lldb) print count
(Int) $R0 = 4
Now we have initialized a new parameter called $R0
In the console print is aliased as p, which is much more convenient and faster to type
(lldb) p count
(Int) $R0 = 4
Expression
expression is used to modify a parameter without restarting compiled application.
(lldb) expression count = 32
(lldb) p count
(Int) $R1 = 32
+In the console expression is aliased as e
(lldb) e count = 32
(lldb) p count
(Int) $R1 = 32
Also by using expression you can create new parameters.
Name of parameter must start with $.
(lldb) e var $myVar = 1234
(lldb) p $myVar
(Int) $R2 = 1234
Print Object
Print Object is the most suitable command to watch parameter value, because it works without creating new parameter.
Command is e -O -- , but luckily it is aliased as po
(lldb) po count
4
Flow Control
When you have stopped the application and you need to proceed to the next line or continue process, you can use following commands:
n - Step over. Executes the following line of code, but does not enter inside functions
s - Step into. Executes the following line of code, and enters inside functions
c - Continue process
You can work without using this commands. There are buttons which do same actions as commands above in XCode.

Now try to change the value of count and see what happens.
(lldb) p count
(Int) $R0 = 4
(lldb) e count = 34
(lldb) s
(lldb) n
count ===> 10
(lldb)
Why print("count ===> \(count)") didn't print 40?
Because the compiler analyzed code and detected that value of count is not changed. I don't know how how exactly compiler works, but I think that is some optimization algorithm.
So make compiler think that count might change.😈
var count = 4
if "abc".hasPrefix("d") { count += 6 } // only for make compiler think count may change
print("count ===> \(count)")
Do the same commands as last time.
(lldb) p count
(Int) $R0 = 4
(lldb) e count = 34
(lldb) s
(lldb) n
count ===> 34
(lldb)
Hurray! We made it
UI Debugging
So now let's move on to one of my favorite parts: UI debugging
Create a regular UIView in storyboard, and connect it to ViewController class.
@IBOutlet private weak var myView: UIView!
Delete all the breakpoints and restart project. After successful start, click on the pause button.

Since LLDB still does not support Swift completely, commands for UI should be written in Objective C. There will not be any problems, if you are familiar with this language. Type the following command in the console:
(lldb) po [[[UIApplication sharedApplication] keyWindow] recursiveDescription]
<UIWindow: 0x7f85a360af90; frame = (0 0; 320 568); autoresize = W+H; gestureRecognizers = <NSArray: 0x60000005fbf0>; layer = <UIWindowLayer: 0x60000002a7a0>>
   | <UIView: 0x7f85a3705060; frame = (0 0; 320 568); autoresize = W+H; layer = <CALayer: 0x608000028e00>>
   |    | <UIView: 0x7f85a3704550; frame = (67 218; 240 128); autoresize = RM+BM; layer = <CALayer: 0x608000028d60>>
   |    | <_UILayoutGuide: 0x7f85a3705340; frame = (0 0; 0 20); hidden = YES; layer = <CALayer: 0x608000028e20>>
   |    | <_UILayoutGuide: 0x7f85a3705910; frame = (0 568; 0 0); hidden = YES; layer = <CALayer: 0x608000028e60>>
So we can see the UI elements and get their storage IDs to access them. But what if there are more, and much more of them?!!! OMG! it will not be convenient to use. XCode knows that we are dumb takes care of it. There is an icon that looks like three screens on the panel.

You have to click on this button to run UI debugging mode. This mode make process of manage and debug UI items much easier
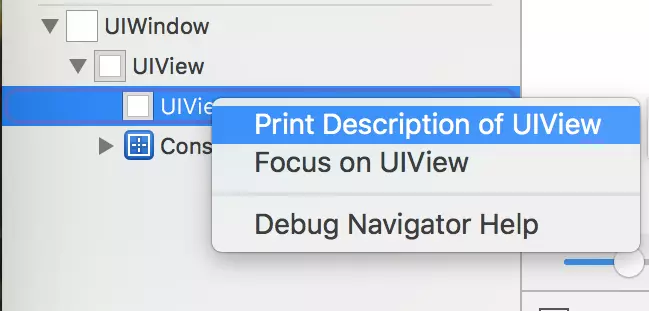
With right click on the item and selecting Print Description, get the description of UI element in console
<UIView: 0x7f85a3704550; frame = (67 218; 240 128); autoresize = RM+BM; layer = <CALayer: 0x608000028d60>>
Save id of UIView in new parameter for further requests.
(lldb) e id $myView = (id)0x7f85a3704550
Now you can change any parameters of UIView.
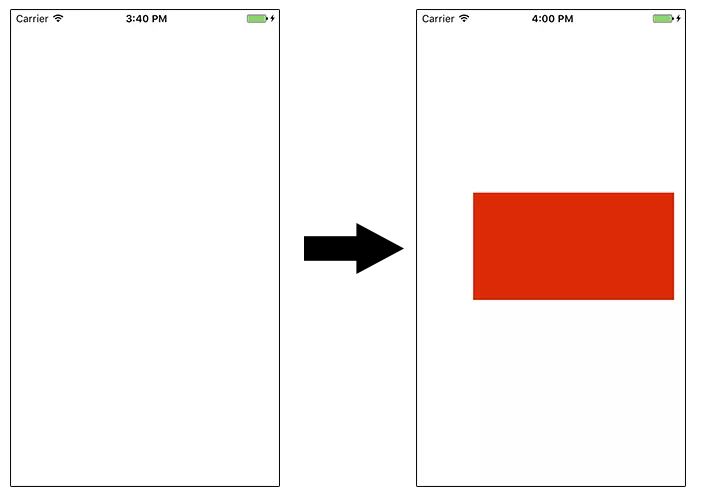
Let's change backgroundColor
(lldb) e (void)[$myView setBackgroundColor:[UIColor redColor]]
But for some reason UIView does not change color. To update UI appication execute [CATransaction flush] command, but since the application is paused, it can not execute any commands. And the color will change only when the application is resumed.
But what if we need to do it without continue? It's easy!
We can call this function in the console, that's all😁
(lldb) e (void)[CATransaction flush]
Breakpoints
Now back to breakpoints. As I said earlier I used breakpoints like stupid monkey incorrectly.
Create a new breakpoint, then make right click on it and choose edit breakpoint
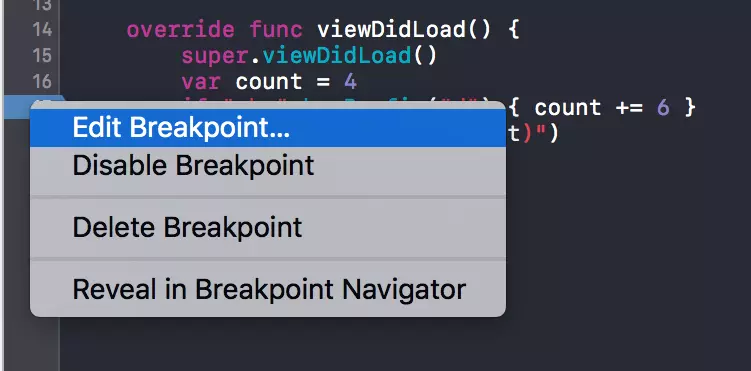
Input parameters according the following picture:
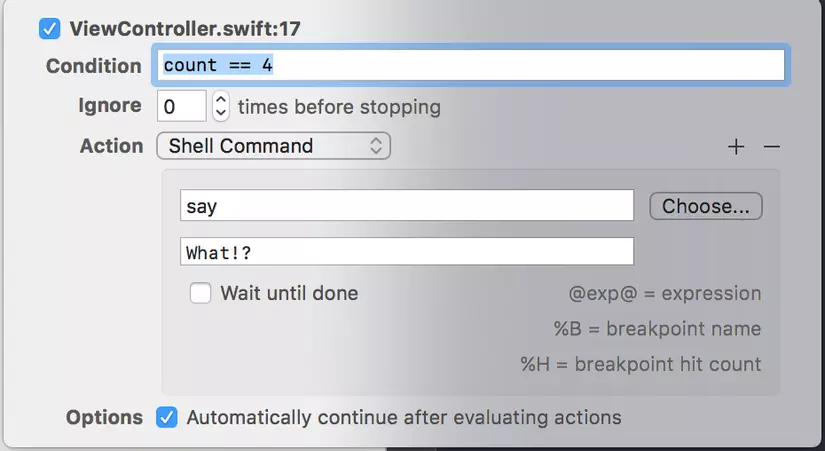
Automatically continue after evaluating actions means that breakpoint will not pause the application. Now run the application. It can speak!!! And we hear it says "what"

Create a new breakpoint on line 15 super.viewDidLoad(), with following values:
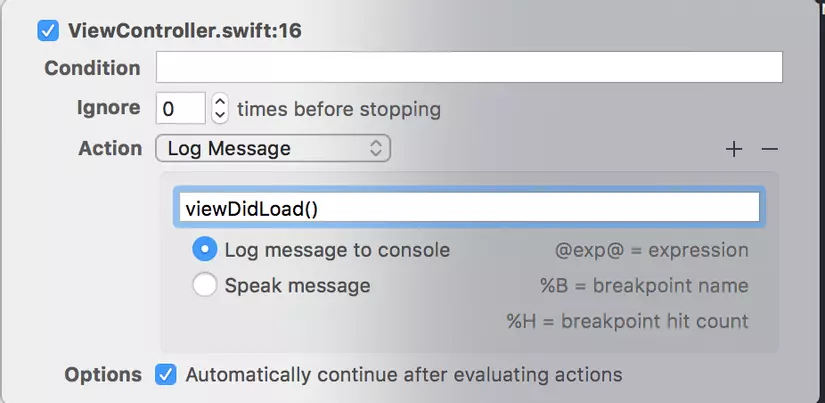
After running the application again, following result will appear in the console:
viewDidLoad()
count ===> 4
Wow! Goodbye NSLog and print It's time for breakpoints!
And about the last, but not the least important possibility of breakpoint.
What if we need to pause application somewhere inside for statement?
Write a simple statement:
for i in 0...100 {
    count += i
}
And put the following breakpoint inside:
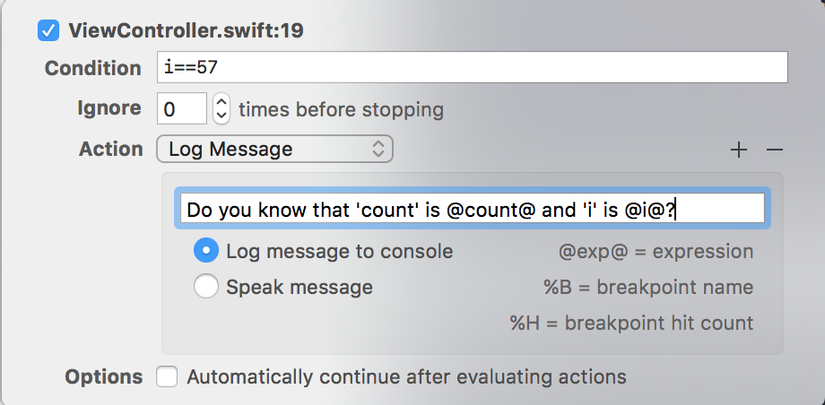 If you want to use any parameter just write it as
 @ parameter_name @.
This breakpoint will pause application when i==57 and following result will appear in the console:
viewDidLoad()
Do you know that 'count' is 1600 and 'i' is 57?
(lldb)
#if
Do you know, when the United States Environmental Protection Agency (EPA) issued a notice of violation of the Clean Air Act to German automaker Volkswagen Group. The agency had found that Volkswagen had intentionally programmed turbocharged direct injection (TDI) diesel engines to activate certain emissions controls only during laboratory emissions testing.
Well, that is what I am up to. If we want to execute different code for Debug and Release we can do it very easy by using #ifdef command.
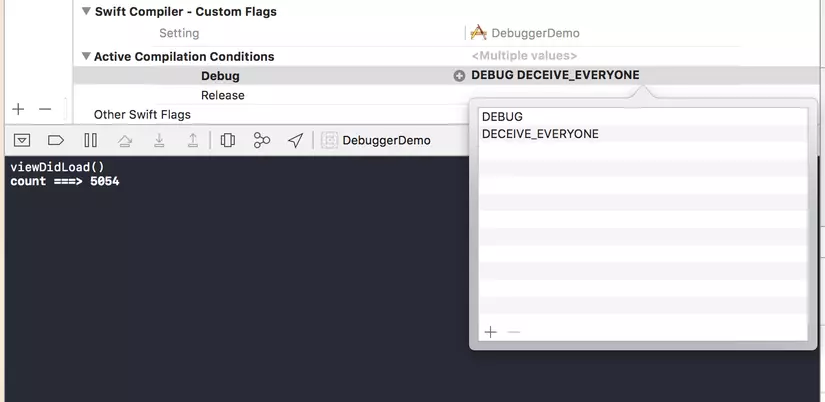
At first add any flag inside Active Compilation Conditions. For example, I add DECEIVE_EVERYONE like Volkswagen Group did 😈
There is already DEBUG flag, usually this flag is enough to use, but for this example we will use a custom flag.
Now type the following lines of code.
let result = harmfulEmissions()
print(result)

...

#if DECEIVE_EVERYONE
func harmfulEmissions() -> Int {
    return 10
}
#else
func harmfulEmissions() -> Int {
    return 100000
}
#endif
Compiler won't display any error for two functions with same names, because compiler takes only one of two functions during compilation.
And it makes project much easy to debuging!!!
That's all! Good buy!

All rights reserved
