Ứng dụng Spark Streaming vào phân tích cảm xúc mạng xã hội Twitter
Bài đăng này đã không được cập nhật trong 3 năm
Intro
Realtime đang dần trở thành tính năng tiêu chuẩn của các ứng dụng hiện nay. Vậy làm thế nào để các mạng xã hội, nền tảng video,... xử lý lượng dữ liệu lớn trong tức thì?
Một giải pháp đang được sử dụng rộng rãi bởi nhiều nền tảng nổi tiếng như Uber, Netflix, Pinterest là Spark Streaming, một phần mở rộng của Spark với tính khả mở và chịu lỗi cao cho phép xử lý big data realtime. Trong phân tích dữ liệu, Spark Streaming đóng vai trò cung cấp nền tảng để đẩy dữ liệu vào các mô hình phân tích tức thời, tăng hiệu năng của mô hình.
Trong bài viết này, mình sẽ giới thiệu cách Spark Streaming hoạt động và ứng dụng nó vào phân tích cảm xúc mạng xã hội Twitter.
Recommendation
- Bạn đọc nên có kiến thức cơ bản về Apache Spark Core
- Hiểu về cách MapReduce hoạt động.
1. Streaming là gì?
Đây là công nghệ truyền dữ liệu liên tục. Nếu như trước đây, khi xem 1 video, ta cần download toàn bộ video đó về thì streaming chia video thành nhiều phần nên ta chỉ cần loading trước 1 lượng dữ liệu nhỏ. Hiện nay, streaming đang dần trở thành 1 phần quan trọng trong sự phát triển của Internet

2. Spark Streaming là gì?
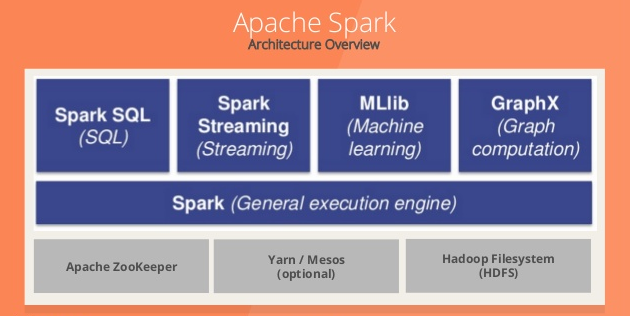
Spark Streaming dựa trên Spark Core, là một phần bổ sung cho Spark để xử lý lượng dữ liệu lớn tức thì và đảm bảo chống chịu lỗi.
Spark Streaming cho phép:
- Scaling: dễ dàng scale lên hàng nghìn node.
- Speed: Spark Streaming có khả năng giảm độ trễn xuống mức vài trăm milliseconds.
- Fault Tolerance: Với các hệ thống bình thường, khi 1 node bị lỗi, failed operator sẽ được tính toán lại ở node khác. Vi vậy, đôi lúc hệ thống không thể hoạt động tiếp cho đến khi node đó tính toán xong. Với Spark, 1 tính toán được chi nhỏ thành các task con cho nhiều node. Khi 1 task bị lỗi, các node khác sẽ thay thế thực hiện việc tính toán đó và do task đã rất nhỏ nên việc thực hiện lại này sẽ nhanh chóng hơn cách tiếp cận trên.
- Integration: DStream đại diện cho series các RDDs trong Spark. Vì vậy, bất cứ function nào của Apache Spark đều có thể dùng để xử dữ liệu.
- Business Analysis: Có thể các thư viện MLlib, SQL, GraphX có thể được áp dụng để phân tích dữ liệu.
3. Spark Streaming Workflow
Tổng quan một hệ thống bao gồm 4 giai đoạn:
- Dữ liệu đẩy vào Spark Streaming có thể đa dạng nguồn từ realtime streaming như Akka, Kafka, Flume, AWS... hoặc static như HBase, MySQL, PostgreSQL, Elastic Search, Mongo DB, Cassandra...
- Từ Spark Streaming Dữ liệu có thể được đưa vào MLlib để áp dụng các mô hình học máy.
- Hoặc dữ liệu cũng có thể đưa vào Spark SQL phục vụ cho truy vấn dữ liệu
- Cuối cùng, sau các thao tác với dữ liệu, nó sẽ được lưu vào database hoặc file system.

Vậy, dữ liệu đẩy vào Spark Streaming sẽ được xử lý thế nào? Dữ liệu đi qua Spark Streaming sẽ được chia thành các batch nhỏ rồi được Spark Engine xử lý để output ra series các batch dữ liệu mới.

4. Usecase: phân tích cảm xúc mạng xã hội Twitter
4.1. Tạo Credentials cho Twitter APIs
Bạn có thể làm theo hướng dẫn của Twitter Developer.
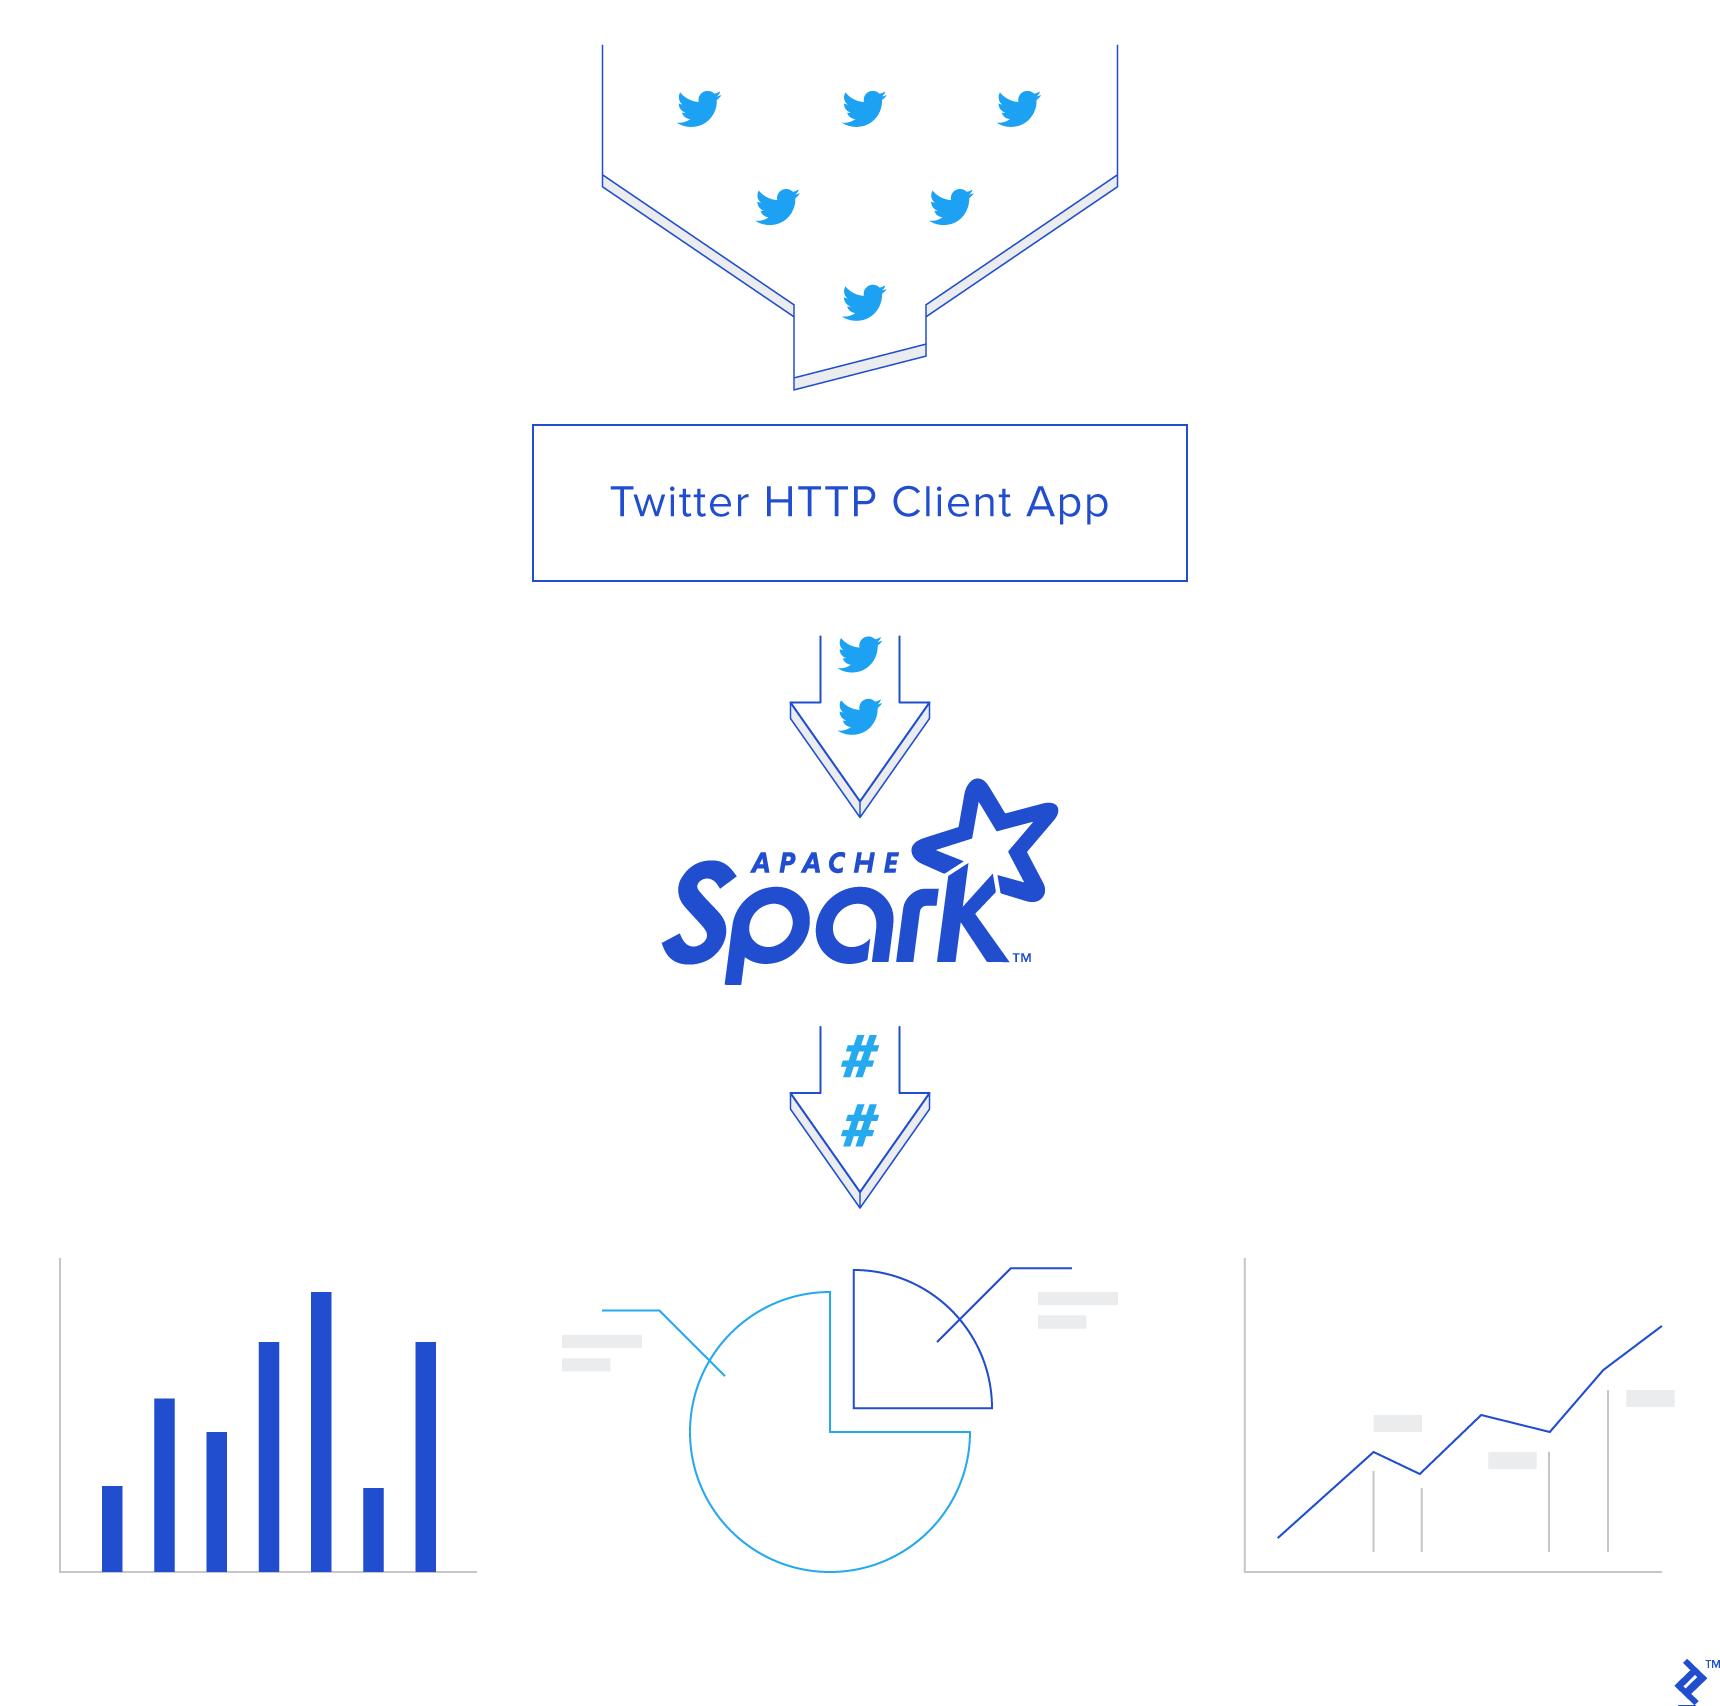
4.2. Tạo Twitter HTTP Client
Ở bước này sẽ chỉ dẫn bạn cách lấy tweets từ Twitter API bằng Python, phân tích cảm xúc với Vader Sentiment và đẩy chúng vào Spark Streaming.
Đầu tiên, tạo file twitter_app.py và thêm những thư viện cần dùng:
import socket
import sys
import requests
import requests_oauthlib
import json
from vaderSentiment.vaderSentiment import SentimentIntensityAnalyzer
Sau đó, thêm các token và key sử dụng cho OAuth nhằm kết nối với Twitter:
# Replace the values below with yours
ACCESS_TOKEN = 'YOUR_ACCESS_TOKEN'
ACCESS_SECRET = 'YOUR_ACCESS_SECRET'
CONSUMER_KEY = 'YOUR_CONSUMER_KEY'
CONSUMER_SECRET = 'YOUR_CONSUMER_SECRET'
my_auth = requests_oauthlib.OAuth1(CONSUMER_KEY, CONSUMER_SECRET,ACCESS_TOKEN, ACCESS_SECRET)
Tiếp, tạo hàm get_tweets nhằm gọi đến Twitter API URL và trả về stream các tweets. Ở đây, mình request đến các tweet của tổng thống Trump @realDonaldTrump.
def get_tweets():
    url = 'https://stream.twitter.com/1.1/statuses/filter.json'
    query_data = [('language', 'en'), ('follow', '25073877')]
    query_url = url + '?' + '&'.join([str(t[0]) + '=' + str(t[1]) for t in query_data])
    response = requests.get(query_url, auth=my_auth, stream=True)
    print(query_url, response)

    return response
Và tạo hàm process_send_tweets_to_spark nhằm xử lý response từ Twitter API, trích xuất và phân tích cảm xúc từng tweet rồi đẩy nó vào Spark Streaming thông qua kết nối TCP.
def process_send_tweets_to_spark(http_resp, tcp_connection):
    for line in http_resp.iter_lines():
        try:
            full_tweet = json.loads(line)
            tweet_text = str(full_tweet['text'].encode("utf-8"))

            # analysis sentiment score
            sentiment_score = analyzer.polarity_scores(tweet_text)["compound"]
            if sentiment_score >= 0.05:
                sentiment = "POSITIVE"
            elif sentiment_score <= -0.05:
                sentiment = "NEGATIVE"
            else:
                sentiment = "NEUTRAL"

            # separate sentiment label with tweet content
            mess =  sentiment + '||||' + tweet_text + '\n'

            tcp_connection.send(bytes(mess, 'utf-8'))
        except:
            e = sys.exc_info()[0]
            print("Error: %s" % e)
Cuối cùng, ta tạo kết nối với Spark qua socket. Cần configure IP là localhost và port là 9009. Tiếp theo, ta gọi hàm get_tweets ở trên để lấy dữ liệu từ Twitter, truyền và xứ lý response và đẩy dữ liệu vào Spark Streaming với process_send_tweets_to_spark.
TCP_IP = "localhost"
TCP_PORT = 9009
conn = None
s = socket.socket(socket.AF_INET, socket.SOCK_STREAM)
s.bind((TCP_IP, TCP_PORT))
s.listen(1)
print("Waiting for TCP connection...")
conn, addr = s.accept()
print("Connected... Starting getting tweets.")
resp = get_tweets()
send_tweets_to_spark(resp, conn)
4.3. Apache Spark Streaming App
Bước này sẽ xây dựng Spark Streaming app xử lý dữ liệu tweet realtime, nhằm lấy ra các hashtags, và tính ra sô lượng tweet được đánh dấu là tích cực, tiêu cực, trung tính.
Trước hết có 2 khái niệm cần hiểu:
- DStream: Là 1 series các RDDs, đại điện cho streaming data.
- StreamingContext: Cung cấp các hàm để tạo DStreams từ đa dạng nguồn input.
Ngoài ra, các bạn có thể tìm đọc kỹ hơn ở Spark document.
Ban đầu, cần tạo Spark Context sc và từ đó tạo Streaming Context scc với batch interval là 2 giây. Do đó, toàn bộ dữ liệu nhận được sẽ được transfrom sau mỗi 2s.
Batch Interval đại diện cho size của batch theo đơn vị thời gian.
Log level được set là `ERROR` nhằm dừng việc ghi log của Spark.
Checkpoint ở đây cho phép RDD định kỳ save lại dữ liệu đã được xứ lý. Trong app này nó là bắt buộc nhằm phục vụ cho stateful transformation (sẽ được giải thích ở phần dưới). Sau đó, ta định nghĩa DStream `dataStream` nhận dữ liệu tweet từ kết nối socket trên côngt `9009` ở trên. Mỗi bản ghi trong DStream tương ứng với 1 dữ liệu tweet.
from pyspark import SparkConf,SparkContext
from pyspark.streaming import StreamingContext
from pyspark.sql import Row,SQLContext
import sys
import requests
import re

# create spark configuration
conf = SparkConf()
conf.setAppName("TwitterStreamApp")
# create spark instance with the above configuration
sc = SparkContext(conf=conf)
sc.setLogLevel("ERROR")
# creat the Streaming Context from the above spark context with window size 2 seconds
ssc = StreamingContext(sc, 2)
# setting a checkpoint to allow RDD recovery
ssc.checkpoint("checkpoint_TwitterApp")
# read data from port 9009
dataStream = ssc.socketTextStream("localhost",9009)
Về phần transformation logic, đầu tiên, với mỗi tweet, ta bỏ đi những ký tự đặc biệt và chuyển về dạng chữ thường. Sau đó, tách từng word ra, ghép với cảm xúc của tweet theo thứ tự (word, Positive, Neutral, Negative). Nếu tweet đó được gắn nhãn cảm xúc nào thì nó sẽ có giá trị là 1, còn lại là 0. Ví dụ, từ test thuộc tweet tweet1 có cảm xúc là POSITIVE, thì kết quả của transformation sẽ là ('test', 1, 0, 0). Tương tự với các nhãn còn lại.
Tiếp theo, lọc bỏ để giữ lại các hashtags với ký tự # ở đầu và map thêm với 1 như sau: (hashtag, Positive, Neutral, Negative, 1) và tạo thành RDD.
Thông thường, để đếm số lần 1 hashtag xuất hiện trong 1 batch có thể dùng reduceByKey. Tuy nhiên, nó sẽ reset kết quả đếm được ở mỗi batch. Trong app của ta, kết quả cần cập nhật từ nhiều batch, vì vậy ta dùng hàm updateStateByKey, bởi nó có thể cập nhật vào kết quả cũ thông qua việc sử dụng checkpoint. Spark gọi đây là Stateful Transformation.
def split_word(line):
    data = list(line.split("||||"))
    # filter out some character and normalize tweet
    tweet = re.sub('[^A-Za-z0-9# ]+', '', data[1]).lower()
    if data[0] == "POSITIVE":
        result = map(lambda x: (x, 1, 0, 0), tweet.split(" "))
    elif data[0] == "NEUTRAL":
        result = map(lambda x: (x, 0, 1, 0), tweet.split(" "))
    else:
        result = map(lambda x: (x, 0, 0, 1), tweet.split(" "))

    return list(result)


# split each tweet into words
words = dataStream.flatMap(split_word)
# filter the words to get only hashtags, then map each hashtag to its sentiment and 1 (hashtag, Positive, Neutral, Negative, 1)
hashtags = words.filter(lambda w: w[0].startswith('#')).map(lambda x: (x[0], (x[1], x[2], x[3], 1)))
# adding the count of each hashtag to its last count
tags_totals = hashtags.updateStateByKey(aggregate_tags_count)
# do processing for each RDD generated in each interval
tags_totals.foreachRDD(process_rdd)

print(tags_totals.count())

# start the streaming computation
ssc.start()
# wait for the streaming to finish
ssc.awaitTermination()
updateStateByKey nhận tham số là hàm aggregate_tags_count, thực hiện logic trên mỗi item trong RDD và update kết quả trược. Ở đây, hàm aggregate_tags_count sẽ lấy tổng tương ứng từng field các hashtag trong new_values rồi cuối cùng cộng với total_sum là kết quả của trước đó đã tính được. Cuối cùng, giá trị này được save vào RDD tags_totals.
def aggregate_tags_count(new_values, total_sum):
    total_sum = total_sum if total_sum else (0,0,0,0)
    pos = [field[0] for field in new_values]
    neu = [field[1] for field in new_values]
    neg = [field[2] for field in new_values]
    count = [field[3] for field in new_values]

    return sum(pos)+total_sum[0], sum(neu)+total_sum[1], sum(neg)+total_sum[2], sum(count)+total_sum[3]
Sau đó, với từng batch, dữ liệu chuyển thành dạng bảng tạm thời với Spark SQL Context rồi thực hiện lệnh chọn top 10 hashtags và lưu vào dataframe hashtag_counts_df.
def get_sql_context_instance(spark_context):
    if ('sqlContextSingletonInstance' not in globals()):
        globals()['sqlContextSingletonInstance'] = SQLContext(spark_context)
    return globals()['sqlContextSingletonInstance']

def process_rdd(time, rdd):
    print("----------- %s -----------" % str(time))
    try:
        # Get spark sql singleton context from the current context
        sql_context = get_sql_context_instance(rdd.context)
        # convert the RDD to Row RDD
        row_rdd = rdd.map(lambda w: Row(hashtag=w[0].encode("utf-8"), pos=w[1][0], neu=w[1][1], neg=w[1][2],  hashtag_count=w[1][3]))
        # create a DF from the Row RDD
        hashtags_df = sql_context.createDataFrame(row_rdd)
        # Register the dataframe as table
        hashtags_df.registerTempTable("hashtags")
        # get the top 10 hashtags from the table using SQL and print them
        hashtag_counts_df = sql_context.sql("select hashtag, hashtag_count, pos, neu, neg from hashtags order by hashtag_count desc limit 10")
        hashtag_counts_df.show()
        # call this method to prepare top 10 hashtags DF and send them
        send_df_to_dashboard(hashtag_counts_df)
    except:
        e = sys.exc_info()[0]
        print("Error: %s" % e)
Bước cuối cùng trong Spark app là gửi dataframe hashtag_counts_df cho dashboard. Ta convert dataframe thành 4 mảng và gửi cho dashboard app qua REST API.
def send_df_to_dashboard(df):
    # extract the hashtags from dataframe and convert them into array
    top_tags = [str(t.hashtag) for t in df.select("hashtag").collect()]
    # extract the counts from dataframe and convert them into array
    pos = [p.pos for p in df.select("pos").collect()]
    neu = [p.neu for p in df.select("neu").collect()]
    neg = [p.neg for p in df.select("neg").collect()]
    # initialize and send the data through REST API
    url = 'http://localhost:5001/updateData'
    request_data = {'label': str(top_tags), 'data_pos': str(pos), 'data_neu': str(neu), 'data_neg': str(neg)}
    response = requests.post(url, data=request_data)
Đây là sample output hashtag_counts_df khi Spark Streaming đang chạy.
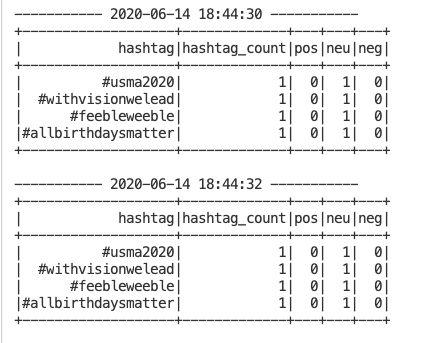
Bạn có thể để ý rằng, output được in ra sau mỗi 2s do đó là batch intervals.
4.4. Dashboard biểu diễn dữ liệu.
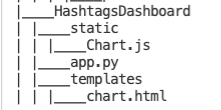
Ta sẽ tạo dashboard với Python, Flask và Chart.js.
Trước hết, download Chart.js và tạo thư mục với cấu trúc như sau:
Trong file app.py, tạo function update_data để update mảng hashtag và các giá trị. Đồng thời, function refresh_graph_data sẽ được gọi bởi AJAX request trả về các mảng giá trị đã được update. Cuối cùng, function get_chart_page render trang chart.html.
from flask import Flask, jsonify, request
from flask import render_template
import ast

app = Flask(__name__)

labels = []
values_pos = []
values_neu = []
values_neg = []

@app.route("/")
def get_chart_page():
    global labels, values_pos, values_neu, values_neg
    labels = []
    values_pos = []
    values_neu = []
    values_neg = []

    # labels = ["#bunkerbitch", "#bunkerboy", "#fakepresident", "#trumpresignnow", "#resignnowtrump", "#bunkerbaby", "#protests2020", "#blacklivesmatter", "#anonymous", "#maga"]
    # values_pos = ["155","103","47","23","23","31","17","20","14","34"]
    # values_neu = ["353","189","83","58","24","39","30","16","26","25"]
    # values_neg = ["367","227","164","113","95","37","49","58","53","34"]
    return render_template('chart.html', values_pos=values_pos, values_neu=values_neu, values_neg=values_neg, labels=labels)

@app.route('/refreshData')
def refresh_graph_data():
    global labels, values_pos, values_neu, values_neg
    # print("labels now: " + str(labels))
    # print("data now: " + str(values_pos))
    # print("data now: " + str(values_neu))
    # print("data now: " + str(values_neg))

    return jsonify(sLabel=labels, sData_pos=values_pos, sData_neu=values_neu, sData_neg=values_neg)

@app.route('/updateData', methods=['POST'])
def update_data_post():
    global labels, values_pos, values_neu, values_neg
    if not request.form:
        return "error", 400
    labels = ast.literal_eval(request.form['label'])
    values_pos = ast.literal_eval(request.form['data_pos'])
    values_neu = ast.literal_eval(request.form['data_neu'])
    values_neg = ast.literal_eval(request.form['data_neg'])

    # print("labels received: " + str(labels))
    # print("data received: " + str(values_pos))
    # print("data received: " + str(values_neu))
    # print("data received: " + str(values_neg))
    return "success", 201


if __name__ == "__main__":
    app.run(host='localhost', port=5001)
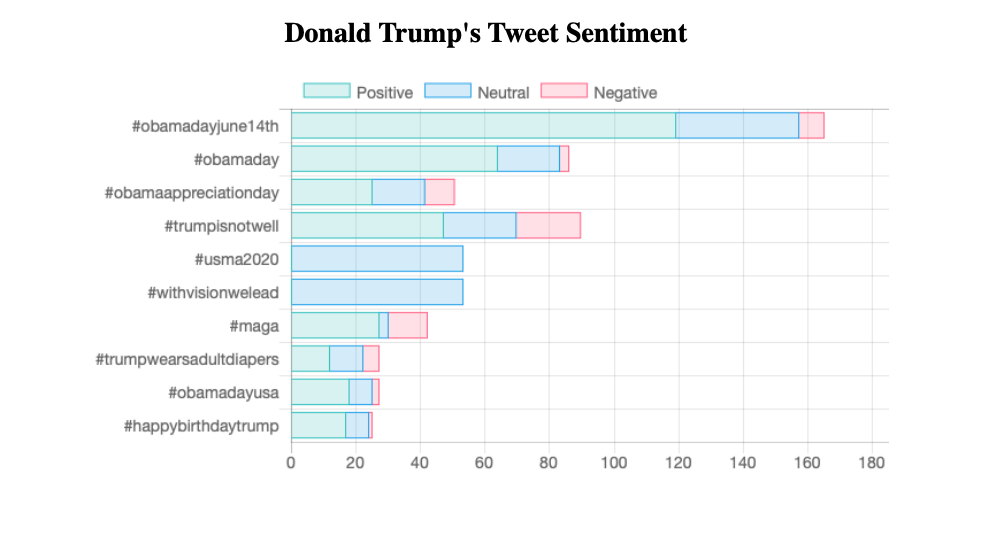
Tiếp theo, tạo chart.html nhằm biểu diễn dữ liệu của ta. Ta cần import Chart.js và jquery.min.js. Ở body tag, ta tạo canvas và gán cho nó ID, rồi tạo chart object , định nghĩa data object như code bên dưới.
Ở phần cuối cùng, Ajax sẽ gọi đến refreshData mỗi giây để cập nhật lại dữ liệu rồi render cho dashboard.
<!DOCTYPE html>
<html>
    <head>
        <meta charset="utf-8"/>
        <title>Donald Trump's Tweet Sentiment</title>
        <script src='static/Chart.js'></script>
        <script src="//ajax.googleapis.com/ajax/libs/jquery/1.9.1/jquery.min.js"></script>
    </head>

    <body>
        <center>
            <h2>Donald Trump's Tweet Sentiment</h2>
            <div style="width:700px;height=500px">
                <canvas id="chart"></canvas>
            </div>
        </center>

        <script>
           var ctx = document.getElementById("chart");
           var myChart = new Chart(ctx, {
                type: 'horizontalBar',
                data: {
                    labels: [{% for item in labels %}
                              "{{item}}",
                             {% endfor %}],
                    datasets: [
                        {
                        label: 'Positive',
                        data: [{% for item in values_pos %}
                                  {{item}},
                                {% endfor %}],
                        backgroundColor: 'rgba(75, 192, 192, 0.2)',
                        borderColor: 'rgba(75, 192, 192, 1)',
                        borderWidth: 1
                    }
                    ,
                    {
                        label: 'Neutral',
                        data: [{% for item in values_neu %}
                                  {{item}},
                                {% endfor %}],
                        backgroundColor: 'rgba(54, 162, 235, 0.2)',
                        borderColor: 'rgba(54, 162, 235, 1)',
                        borderWidth: 1
                    },
                    {
                        label: 'Negative',
                        data: [{% for item in values_neg %}
                                  {{item}},
                                {% endfor %}],
                        backgroundColor: 'rgba(255, 99, 132, 0.2)',
                        borderColor: 'rgba(255,99,132,1)',
                        borderWidth: 1
                    }
                    ]
                },
                options: {
                    scales: {
                        xAxes: [{ stacked: true }],
                        yAxes: [{
                            ticks: {
                                beginAtZero:true
                            },
                            stacked: true
                        }]

                    }
                }
           });

           var src_Labels = [];
           var src_Data_pos = [];
           var src_Data_neu = [];
           var src_Data_neg = [];

            setInterval(function(){
                $.getJSON('/refreshData', {
                }, function(data) {
                    src_Labels = data.sLabel;
                    src_Data_pos = data.sData_pos;
                    src_Data_neu = data.sData_neu;
                    src_Data_neg = data.sData_neg;
                });

                myChart.data.labels = src_Labels;
                myChart.data.datasets[0].data = src_Data_pos;
                myChart.data.datasets[1].data = src_Data_neu;
                myChart.data.datasets[2].data = src_Data_neg;

                myChart.update();

            },1000);
        </script>
    </body>
</html>
4.5. Toàn bộ app.
Hãy chạy theo thứ tự:
- Twitter App Client
- Spark App
- Dashboard Web App
Sau đó bạn có thể truy cập dashboard qua http://localhost:5001. Kết quả khi đang cập nhật sẽ như sau:
5. Kết luận
Vậy là mình đã giới thiệu qua về Spark Streaming và hướng dẫn các bạn ứng dụng vào usecasse phân tích cảm xúc mạng xã hội. Toàn bộ source code các bạn có thể tìm ở github.com. Cảm ơn các bạn đã theo dõi đến cuối bài viết này.
Tài liệu tham khảo
All rights reserved
