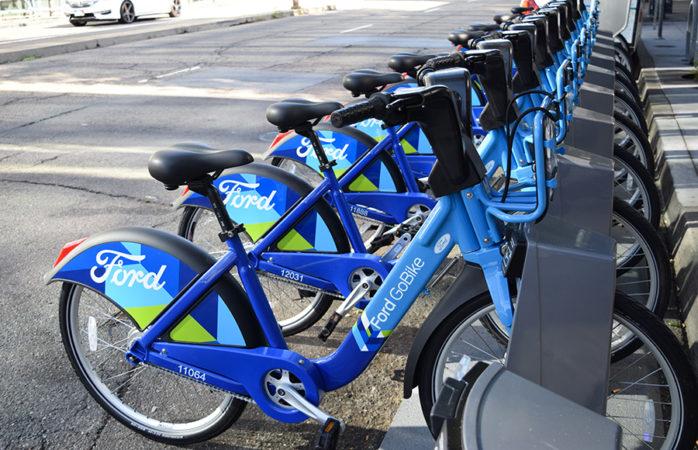
Do you need to work more effectively in the rental bike industry? Let's examine the Ford GoBike System in San Francisco in more detail.
This blog post is part of Udacity Data Scientists Nanodegree Program.
Detailed analysis with all required code is posted in https://github.com/NTN-hacker/Write-a-Data-Science-Blog-Post
Overall
We will talk about the variables that impact the GoBike system in this post, and by doing so, we will be able to determine what has to be improved in order to draw in more users.
The data including information of 183.412 ford gobike trips in San Francisco area with 16 variables (duration_sec, start_time, end_time, start_station_id, start_station_name, start_station_latitude, start_station_longitude, end_station_id, end_station_name, end_station_latitude ,end_station_longitude, bike_id, user_type, member_birth_year, member_gender, bike_share_for_all_trip). But some data have wrong so it needs to be clean them.
1. How age of rider distributed?
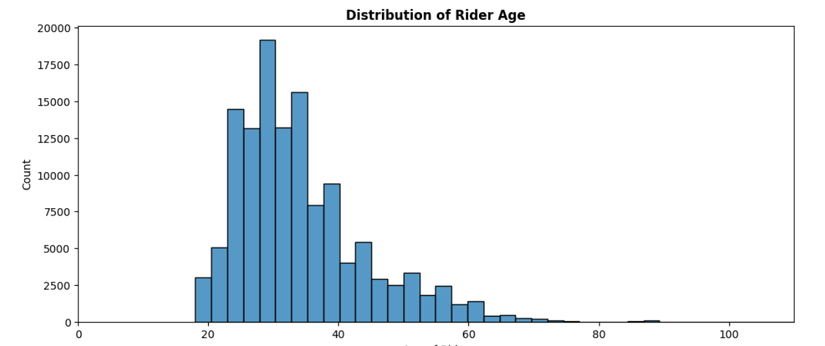
An analysis of user demographics reveals that a significant majority of participants, particularly those between the ages of 20 and 45, prefer bike-sharing services. Furthermore, among the three gender groups, men constitute the largest segment of bike riders.
2. What are percentage of User Type and Member Gender?
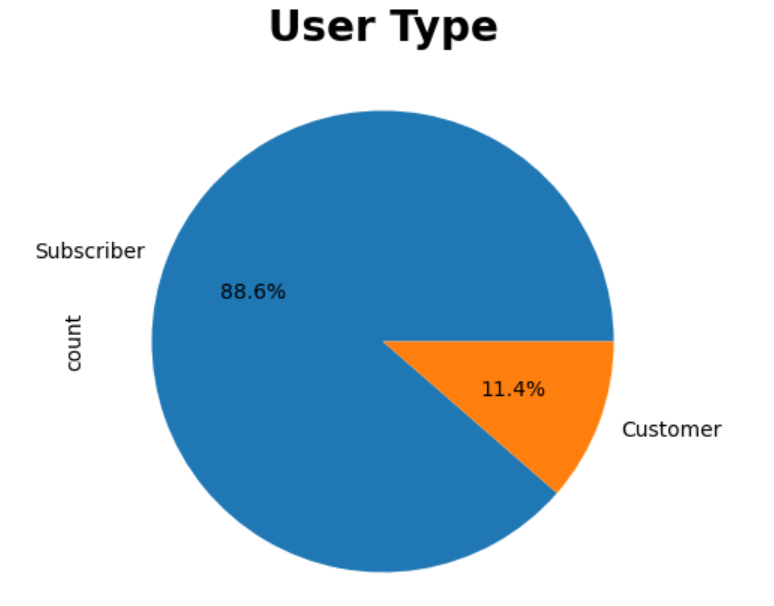
A huge amount of people have signed up for subscriptions.
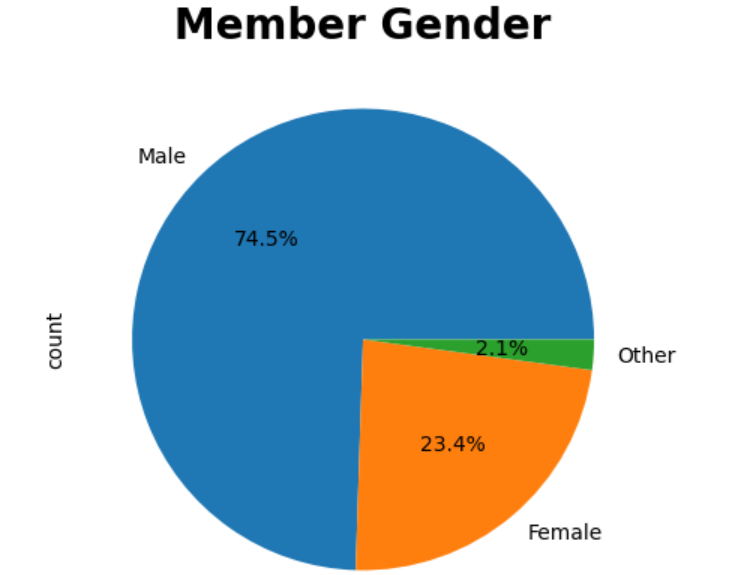
There are more Male members than Female members. There are more women than Other.
3. Is there any relationship between duration second and user type?
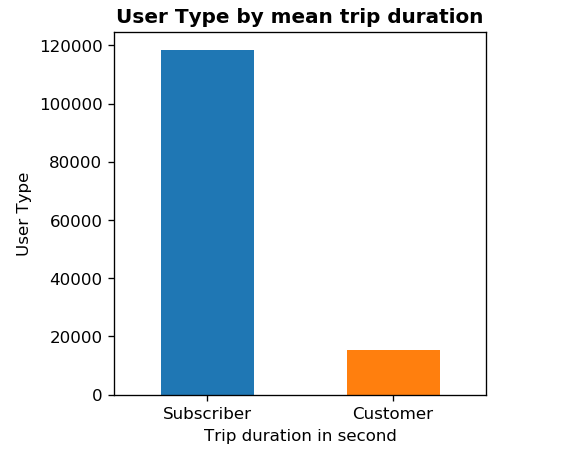
Although the number of Subscriber user is more than number of Customer, Customer trip duration is more than Subscriber
4. Is there any relationship between duration second, gender and user type?
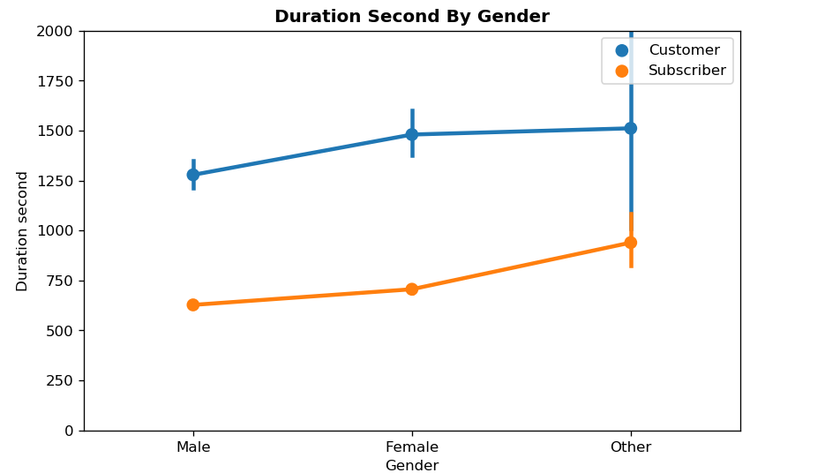
Subscriber have less trip than Customer beside that Male is less than Female also.
5. Is there any relationship between duration second, week day and user type?
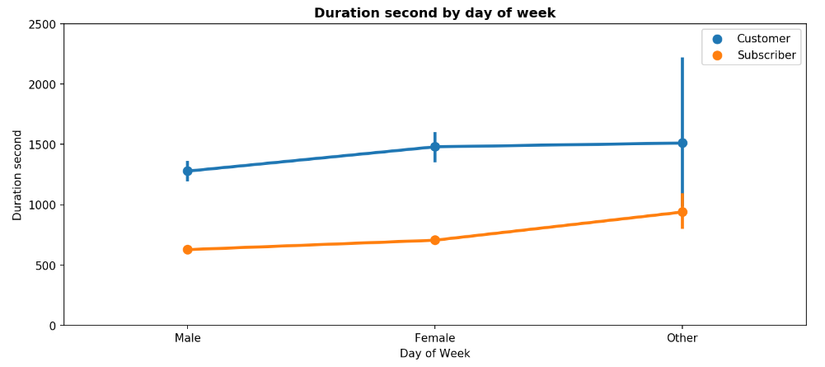
It seems that more trip in weekend than day week for Customer and for Subscriber it the same for all week.
6. What is top 10 Start and End Station have most rider?
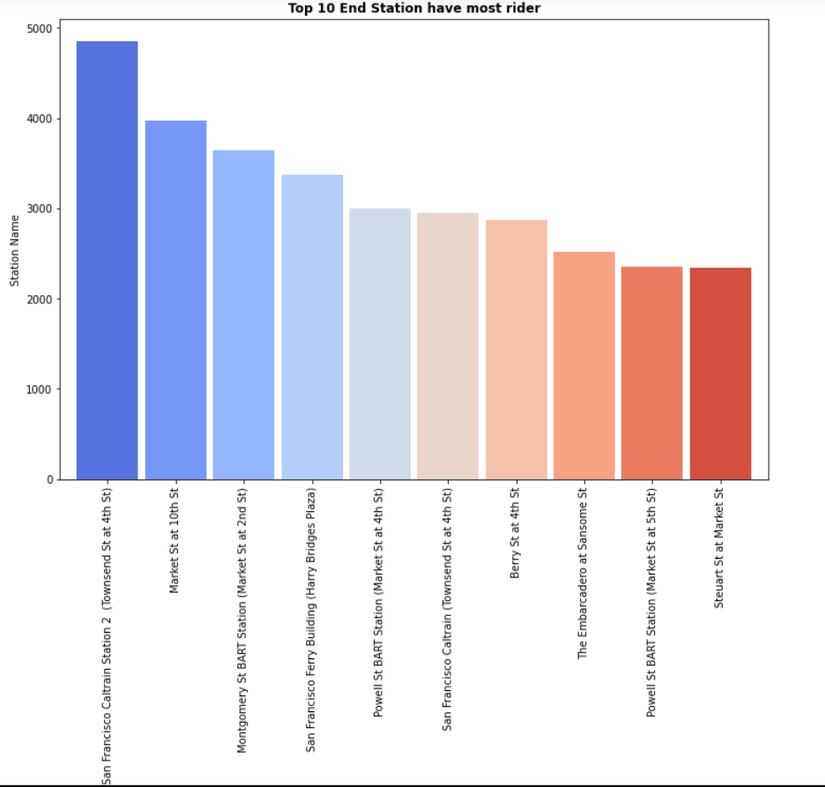
The previous graphic shows that when riders begin to ride, Market St. near 10th St. has the greatest number of riders. However, this is not the finish station. It's a San Francisco Caltrain Station 2 since there may be a lot of lovely places and well-known restaurants nearby.
Conclusions
In summary, our analysis reveals a notable proportion of subscribers within the user base, while riders, irrespective of their subscription status, tend to spend an extended duration on their biking journeys compared to other consumers. It is imperative that we devise a strategic approach to potentially convert some of these subscribers into full-fledged customers, optimizing our service offerings to cater to their distinct needs and preferences.
Furthermore, it is worth emphasizing that a significant portion of bike riders predominantly engages in cycling activities during the weekends. Given this insightful trend, it presents an exciting opportunity for us to explore the organization of engaging events, such as game shows and well-targeted marketing campaigns, during these peak weekend periods. Leveraging these weekend hours effectively can potentially serve as a powerful means to attract and retain a more extensive clientele and bolster our market presence.
My privacy information
If any problem is unclear, you could response for me via my email: nguyennhan8521@gmail.com Thank you.
All rights reserved
